Core Families
Six families grade from measurements every cloud replay already produces.
Each one is graded on the rungs in How a report is graded unless its section says it has a fixed scale.
Where a family produces findings, each finding has a stable key built from the family, a check id, an endpoint pattern and a field path, so the same failure on the next replay carries the same key and an acceptance keeps covering it.
Endpoint patterns replace identifier segments with a placeholder, so GET /v2/orders/8f3c and GET /v2/orders/91aa are one endpoint, GET /v2/orders/{id}.
Regression
Measures the assertion pass rate: assertions passed over assertions run.
The default role is Blocks below B.
Inputs. The assertion success and failure counts of the report.
The family grades n/a with "No assertions ran in this replay." when the total is zero, so a replay with no assertions does not earn a hollow A.
Findings. One per failed assertion type per endpoint, check id assertion.<type> in lower case, for example assertion.http_response_body.
For a body assertion the field path is the path that differed; when an assertion failed on several fields the field path is the sorted list ($.eta, $.total), and accepting one of those paths alone does not cover it.
The detail names the assertion type, the endpoint and the field, for example "... failed on GET /v2/orders/{id} at $.total".
Detail on the report. "N of M assertions failed." with the pass rate as the measure, for example "99.7% pass".
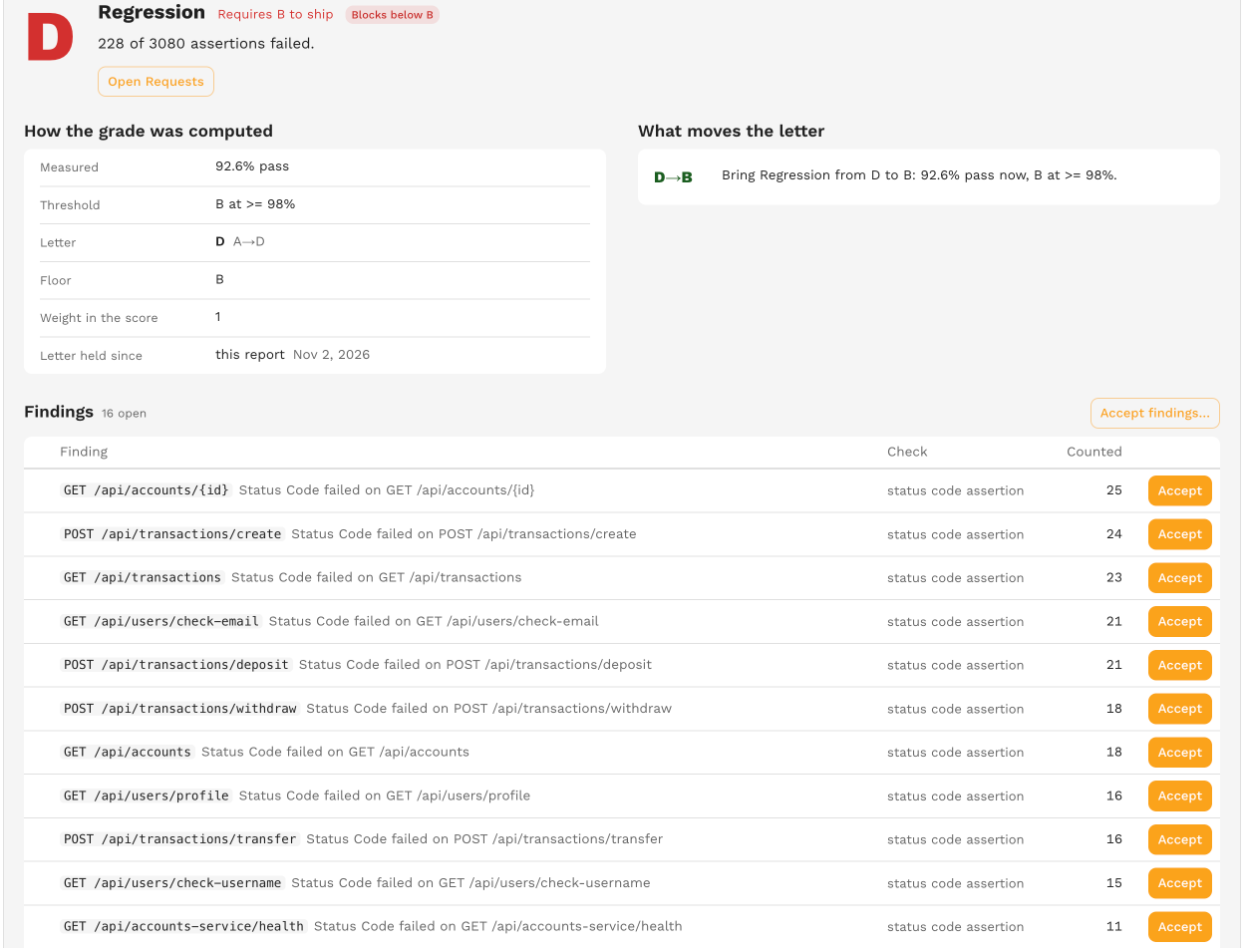
Accepting a finding counts its assertions as passed; the denominator does not change.
The Requests action opens the Accuracy tab of the report.
Performance
Measures the headline latency percentile against its goal, with the error rate as a cap.
The default role is Advises.
Inputs. The headline percentile is the highest one the test config has a report-wide goal for: p99, else p95, else p50.
A config with no latency goal is held to the recording's p99 instead.
Goals scoped to one endpoint are that endpoint's goal, not the service's, and do not count here.
The family grades n/a with "No transactions were sent to the service." when the replay sent nothing, and with "The test config has no latency goal and the recording has no p99 to compare with." when there is nothing to grade against.
The letter. The boundaries are the percent over the goal the percentile may run: at or under the goal is A, up to 10% over is C, up to 25% over is D, beyond is F.
An A also needs the percentile to be at most 5% over the previous graded report's, otherwise the letter is B.
The share of transactions that got no response caps the letter: above 1% the letter is at best C, above 5% at best D.
Detail on the report. For example "p99 412 ms, 3% over the p99 goal of 400 ms; 0.2% of 1204 transactions got no response. Previous report p99 398 ms."
The threshold reads "A within the p99 goal and at most 5% over the previous report" or "B at <= 0% over the p99 goal".
Performance produces no findings; there is nothing to subtract from a percentile.
The Charts action opens the performance charts.
Mock fidelity
Measures the responder match rate: calls answered from a mock over every call the responder saw.
The default role is Blocks below B.
The same rate is the mock fidelity factor of confidence.
Inputs. The responder's matched, no-match and passthrough counts.
The family grades n/a with "Nothing was mocked in this replay." when all three are zero.
Findings. One per outbound endpoint the responder did not serve from a mock: check id no_match for a call no mock matched and passthrough for a call passed through to the real service.
The endpoint pattern starts with the mock host, for example api.stripe.com POST /v1/charges.
Replays in the responder's low-data mode produce no mock findings, only the aggregate rate.
Detail on the report. "N of M mocked calls matched; X had no match, Y passed through to the real service." with the measure "97.2% matched".
Accepting a finding counts its calls as matched.
The Mocks action opens the Mocked Responses tab.
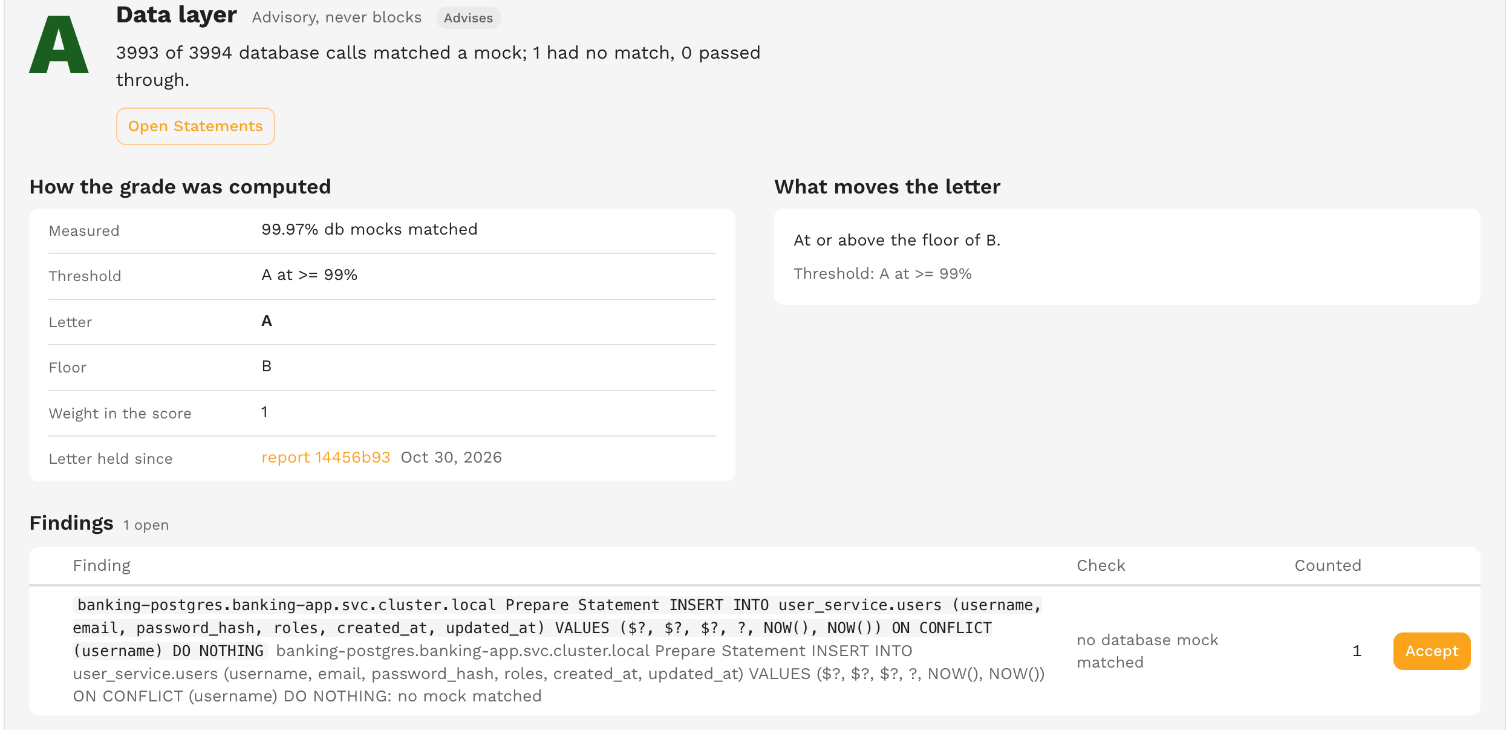
Data layer
Measures how the replay's database traffic compared with the recording.
The default role is Advises.
Inputs. When the test config ran the sqlOutput assertion, the family grades the statement comparison: statements that matched the recording over statements compared, shown as "98% statements match".
Otherwise it grades the responder's database-protocol mocks: database calls that matched a mock over every database call, shown as "98% db mocks matched".
The family grades n/a with "The replay touched no database." when neither exists.
Findings. statement_different for a statement that differed from the recording, keyed on the statement's shape (whitespace folded, literals replaced by ?); db_no_match and db_passthrough for database mock outcomes, keyed on the mock host and the statement's shape.
Detail on the report. "N of M SQL statements differed from the recording." or "N of M database calls matched a mock; X had no match, Y passed through."
The Statements action opens the Mocked Responses tab.
Runtime health
Measures what Kubernetes said about the system under test while the replay ran.
The default role is Advises.
The scale is fixed and the config cannot move it.
Inputs. Warning events on the workload's own objects, counted only after the operator saw the system under test become ready.
Events on Speedscale's own pods and the probe failures of the rollout the operator performs at replay start do not count.
The family grades n/a with "The replay did not run in a Kubernetes cluster." for replays with no cluster.
| Letter | Rung |
|---|---|
| A | Nothing happened |
| B | Readiness probe failures only |
| C | A container restart, no OOM kill |
| D | An OOM kill or crash loop the service recovered from |
| F | The service never became ready and the operator gave up waiting |
Findings. One per kind of warning, per service rather than per pod since pod names change on every rollout: restart, crash_loop, oom_kill and readiness_wait, each counted.
Detail on the report. "2 restarts, 0 crash loops, 1 OOM kill, 0 readiness probe failures."
The measure names what set the letter: "never became ready", "1 OOM kill", "2 restarts" (restarts and crash loops together) or "3 readiness waits", and "0 restarts" when nothing happened.
The trend chart for this family always plots restarts and crash loops.
Accepting a finding takes that many events out of the count.
The Pods action opens the replay progress panel on the Overview tab, where the Kubernetes diagnosis sits.
Trend
Measures how many families fell since the previous graded report of the same service and build.
The default role is Advises.
The scale is fixed.
Inputs. The previous graded report is the newest Passed or Missed Goals report with a stored grade, of the same service (a multi-service snapshot keys on all of its services) and the same SUT image tag, started inside the trend window before this replay.
The window defaults to 14 days and is set on the Readiness tab of the test config.
The family grades n/a with "No previous graded report of <service> in the trend window." (the service name followed by "at <tag>" when the report carries an image tag), or "No previous graded report to compare with." when the report has no service.
| Letter | Rung |
|---|---|
| A | No family fell since the previous report |
| B | One advisory family fell |
| C | One blocking family fell one letter |
| D | More than that |
| F | Three or more families fell, or a blocking family fell three letters |
Detail on the report. "No family fell since the previous report." or "Fell since the previous report: Regression, Performance." followed by "Compared with report <id> of <date>."
The detail lists the previous report's letters, and the Service trend button opens the service trend.
Trend produces no findings.