Databases
Speedscale records the calls your services make to their databases, from the network, alongside the rest of their traffic. You get the statements your app actually sent in production or staging, with their bound values, who ran them, and how they ended, with no database credentials, no agent on the database server and no slow query log to turn on.
That turns database traffic into something you can use:
- See what your services ask of the database. Every statement, per service and over time, instead of a sample or a guess from the code.
- Find the calls that matter. Narrow millions of calls to the failing, slow, deadlocked or cancelled ones, or to one user, session or table.
- Understand a single call. The SQL with its values filled in, the error with its name, and what else ran on the same connection.
- Test without the database, or test the database. Mock the database so a service runs with no database at all, or replay the recorded statements against a database to regression test a migration or load test it.
Database traffic explains what is recorded for each call and which databases are supported.
Watch database traffic
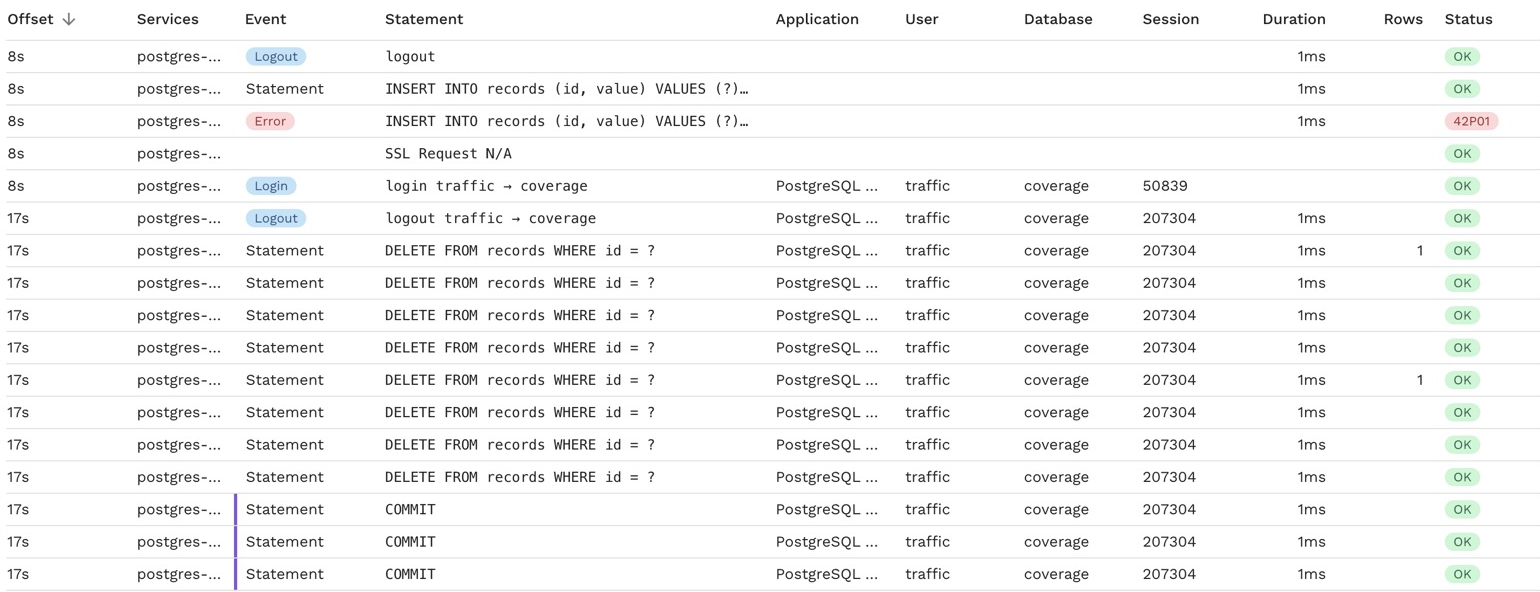
On the Traffic page, filter to a database protocol or add any Database filter and the grid switches to the Database columns: event, statement, application, user, database, session, duration, rows and status. The database icon in the grid toolbar switches between these columns and the default ones. Statements read as their shape, with values masked, so repeats of one statement line up.
Find database calls
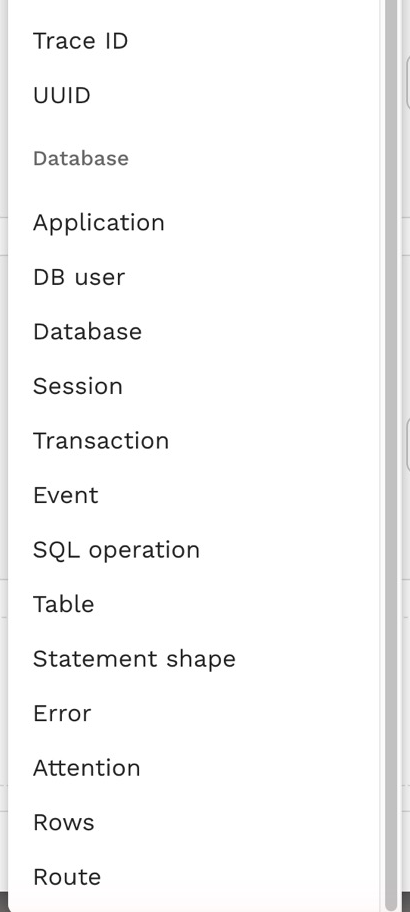
The filter builder has a Database group. Each fact is its own filter:
| Filter | Example |
|---|---|
| Application, DB user, Database, Session | Every call one service account made, or everything on one connection |
| Transaction, Event | Statements inside a failed transaction, or every login |
| SQL operation, Table, Statement shape | Every DELETE, every call that touches orders, or every execution of one statement |
| Error, Attention, Rows | Every 40P01 deadlock, every timeout, or every query that returned more than 1,000 rows |
The value pickers offer the values in your traffic, and errors show with their names, such as 23505 · unique_violation.
Inspect a database call
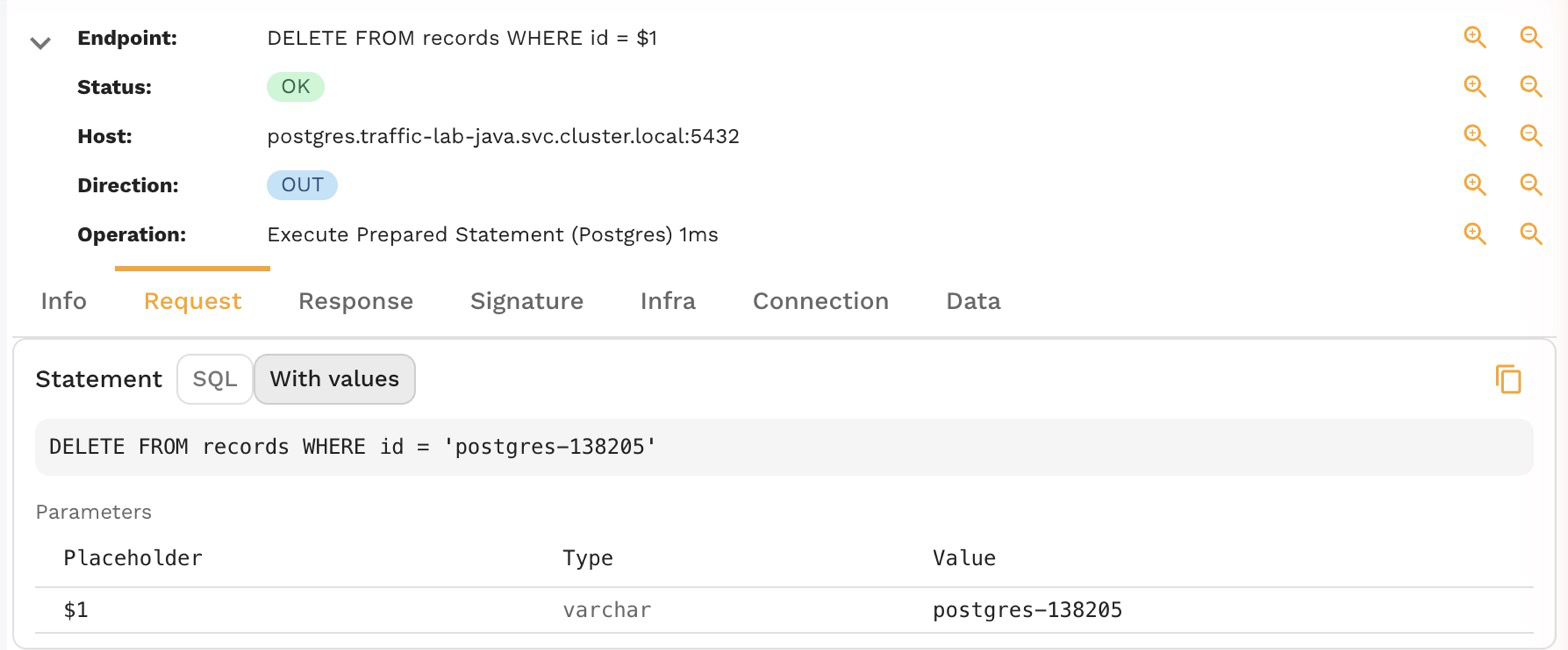
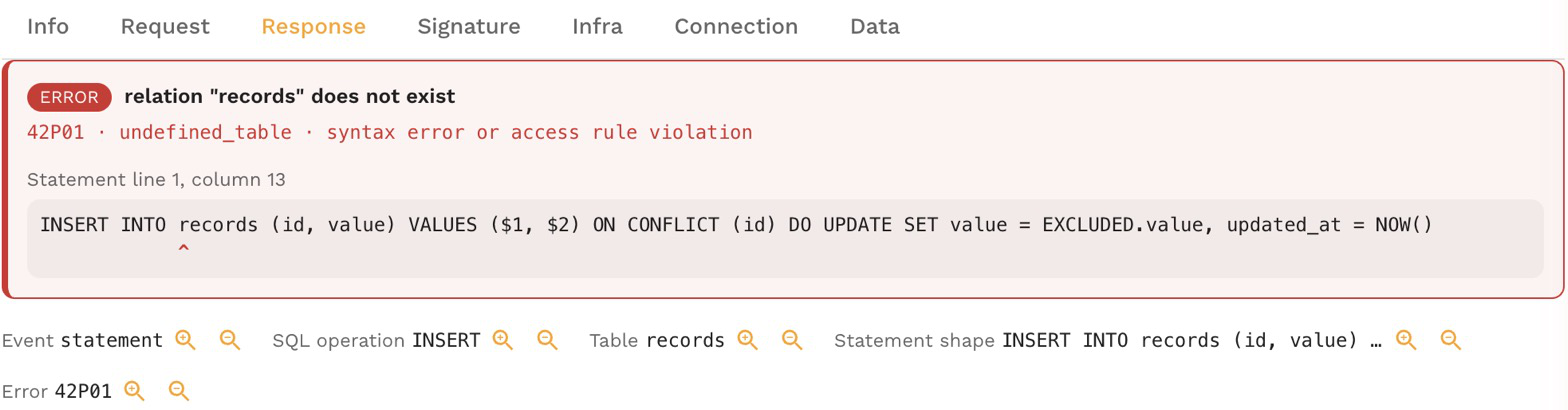
Open any database call to see:
- The statement with its bound values filled in, so you can copy it into
psqlormysql. - How it ended: rows and command tags, or an error card with the SQLSTATE or MySQL error number, its name and the position in the SQL.
- Why it needs attention: a cancel, a timeout, a deadlock, a lock timeout or a terminated session. For a deadlock, a lock timeout, a timeout or a cancel, the drawer also lists the statements that were running at the same time, which is usually where the cause is.
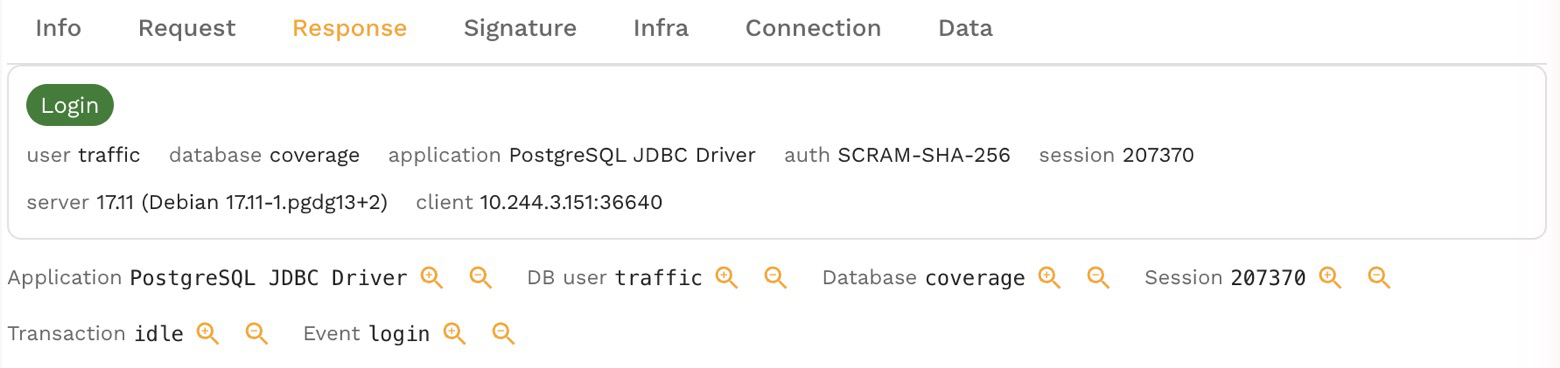
- The login that opened the connection, and whether the statement ran inside a transaction.
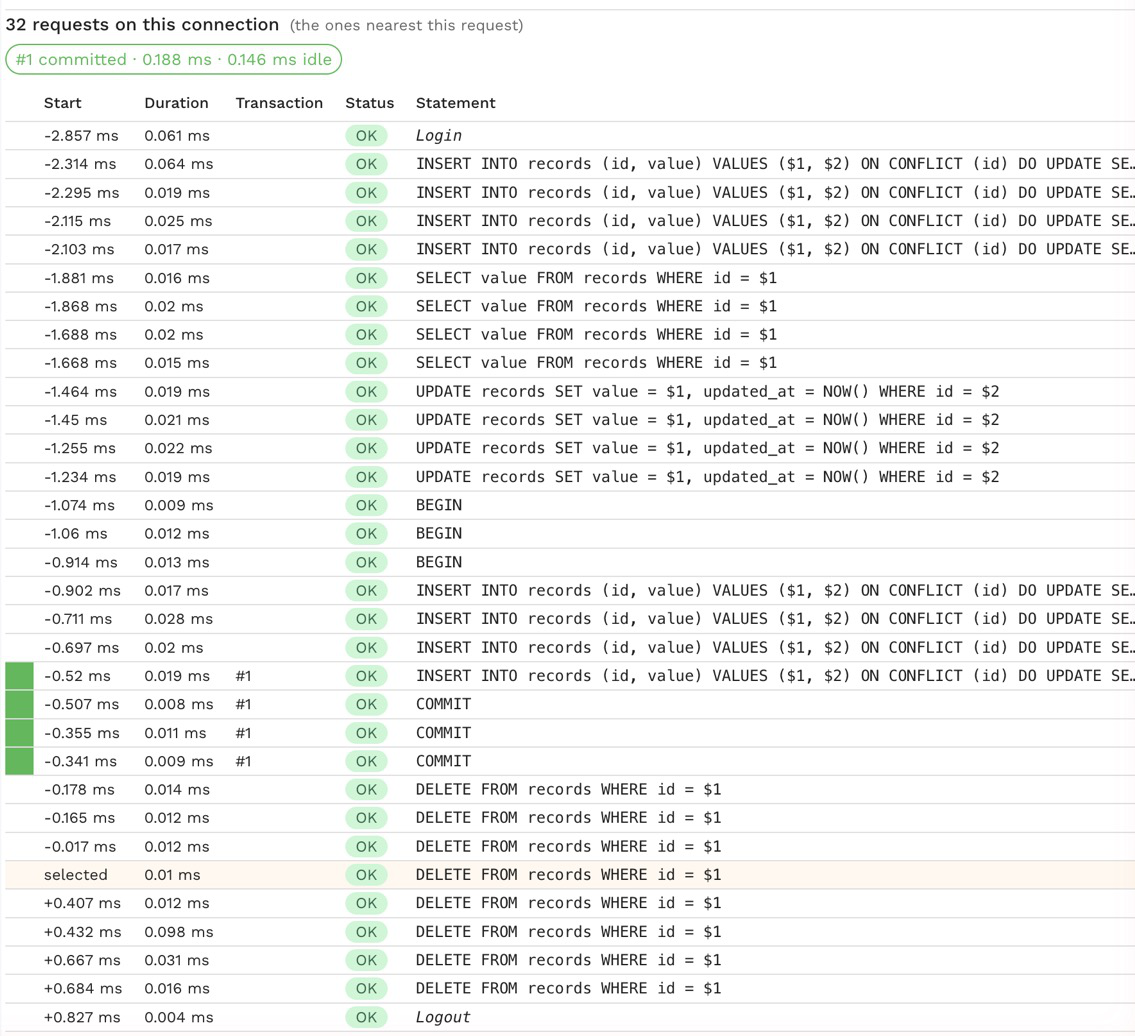
- The Connection tab: every call on the same database connection in order, grouped into transactions with how each one ended.
- The result sets the database returned.
Every database fact in the drawer is also a one-click filter or exclusion.
See a snapshot's database schema
A snapshot with database traffic shows the tables and columns its statements read and write, inferred from the traffic, so you can see what a service depends on without access to the database.
Mock a database
A snapshot serves recorded database responses as mocks, so a service runs in a replay without its database. Mock a database explains what a SQL mock matches on and the transforms that tune it.
Load and regression test a database
Choose the database as the replay target and the recorded statements become the tests: replay them once against a migrated schema or a new version to see every statement that now fails, or with many sessions to load test the database. See Load and Regression Test a Database.
Develop locally
proxymock records, inspects, compares, mocks and replays database traffic on your own machine with the same facts and filters. See Databases in proxymock.