Find statements with filters
A busy service runs millions of database calls a day. The Database filters on the Traffic page narrow them to the ones you care about in one step: the statements that failed with a given error, the calls that deadlocked, everything one service account ran, every statement that touched a table, or the queries that returned too many rows. Because the filters compare the facts Speedscale recorded for each call, they need no access to the database.
When a filter targets database traffic, the grid switches to the Database columns, so the matches read like a database profiler trace.
The Database filters
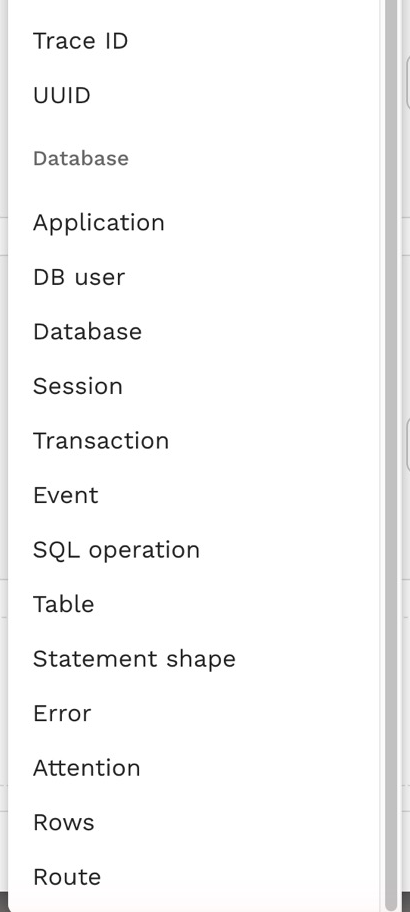
Open Filters, add a filter and pick a field from the Database group at the end of the list:
| Filter | What it matches | Example |
|---|---|---|
| Application | The client's application name | Every call from one service's connection pool |
| DB user | The database user that logged in | Everything a service account or a person ran |
| Database | The database it connected to | One schema in a shared server |
| Session | The server's id for the connection: the Postgres backend pid or the MySQL connection id | Everything one connection did |
| Transaction | idle, active or failed when the statement started | Statements that ran inside a transaction that had already failed |
| Event | login, logout or statement | Every login, to see who connects and how often |
| SQL operation | The leading command, such as SELECT or DELETE | Every DELETE |
| Table | A table the statement names | Every call that touches orders |
| Statement shape | The statement with its values masked | Every execution of one query |
| Error | The SQLSTATE for Postgres or the error number for MySQL | Every 23505 unique violation or 40P01 deadlock |
| Attention | cancelled, timeout, deadlock, lock_timeout, terminated, cancel_request or aborted | Every call that timed out |
| Rows | Rows returned or changed, compared with is, greater than or less than | Queries that returned more than 1,000 rows |
| Route | The route the app wrote into the statement's SQL comment | Every statement orders#show ran |
Text fields compare with is, contains or regex, and each can be negated. The value pickers offer the values in the traffic you are looking at, and errors show with their names, such as 23505 · unique_violation.
Filter by trace id
The Trace ID filter matches one request's trace across protocols: HTTP and gRPC calls by their traceparent or B3 headers, and database calls by the trace id the app wrote into their SQL comment. A filter on a header would drop the database calls, so use Trace ID to see a request together with the queries it ran. You can paste a whole traceparent; the filter keeps only the trace id. See Link queries to the request that ran them.
Filter from a call
In the request drawer, every database fact of a call carries a filter and an exclude button. Open a failed call, select the filter next to its error code, and the grid shows every call that failed the same way; select the one next to its session to follow that connection. See Inspect a statement.
Recipes
| To find | Filter on |
|---|---|
| Deadlocks and lock timeouts | Attention is deadlock, or Attention is lock_timeout |
| Duplicate-key failures | Error is 23505 (Postgres) or 1062 (MySQL) |
| Slow writes | SQL operation is UPDATE and Duration greater than 100 ms |
| Unbounded queries | Rows greater than 1000 |
| Work done inside failed transactions | Transaction is failed |
| One connection's story | Session is the session id, then open any call's Connection tab |
| Who touches a sensitive table | Table is the table, then read the User and Application columns |
Limits
- The connection facts (user, database, application, session) need a capture from Speedscale 2.5.1103 or later, and the route and trace id need 2.5.1153 or later. Traffic indexed before an upgrade keeps the facts it was indexed with, so filter on a recent time range.
- Database filters match PostgreSQL and MySQL calls. Other databases are found with the usual filters, such as Host or L7 Protocol.