Databases
proxymock records the calls your app makes to its database while you use the app, by sitting between the app and the database. From one recording you can see exactly what the app asks of the database, test the app with no database at all, and test the database with the app's real traffic. You need no access to a shared database, no database logs, and no change to the app beyond the port it connects to.
What that gives you:
- See the SQL your code really sends. ORMs, drivers and connection pools hide it. proxymock shows every statement with its bound values, in order, per connection.
- Catch problems before review. N+1 query loops, statements that run on every request, slow statements and errors show up while you develop, not in production.
- Know what a change did to the database. Compare two recordings to see new, removed and slower statements and schema changes.
- Run without the database. Mock it from the recording so tests and coding agents run offline and deterministically.
- Test the database with real traffic. Replay the recorded statements against a new schema or version, or with many sessions as a load test.
Every step works from the proxymock CLI, from proxymock web, and from an AI coding assistant through the proxymock MCP server. Database traffic explains what is recorded for each call and which databases are supported.
Record your database
Start the recorder with a port mapped to your database and point your app at that port:
proxymock record --map 15432=postgres://localhost:5432 --app-port 8080
The setup pages cover each database: PostgreSQL, MySQL, MongoDB, Redis and DynamoDB.
Watch and inspect statements
Open the recording with proxymock web:
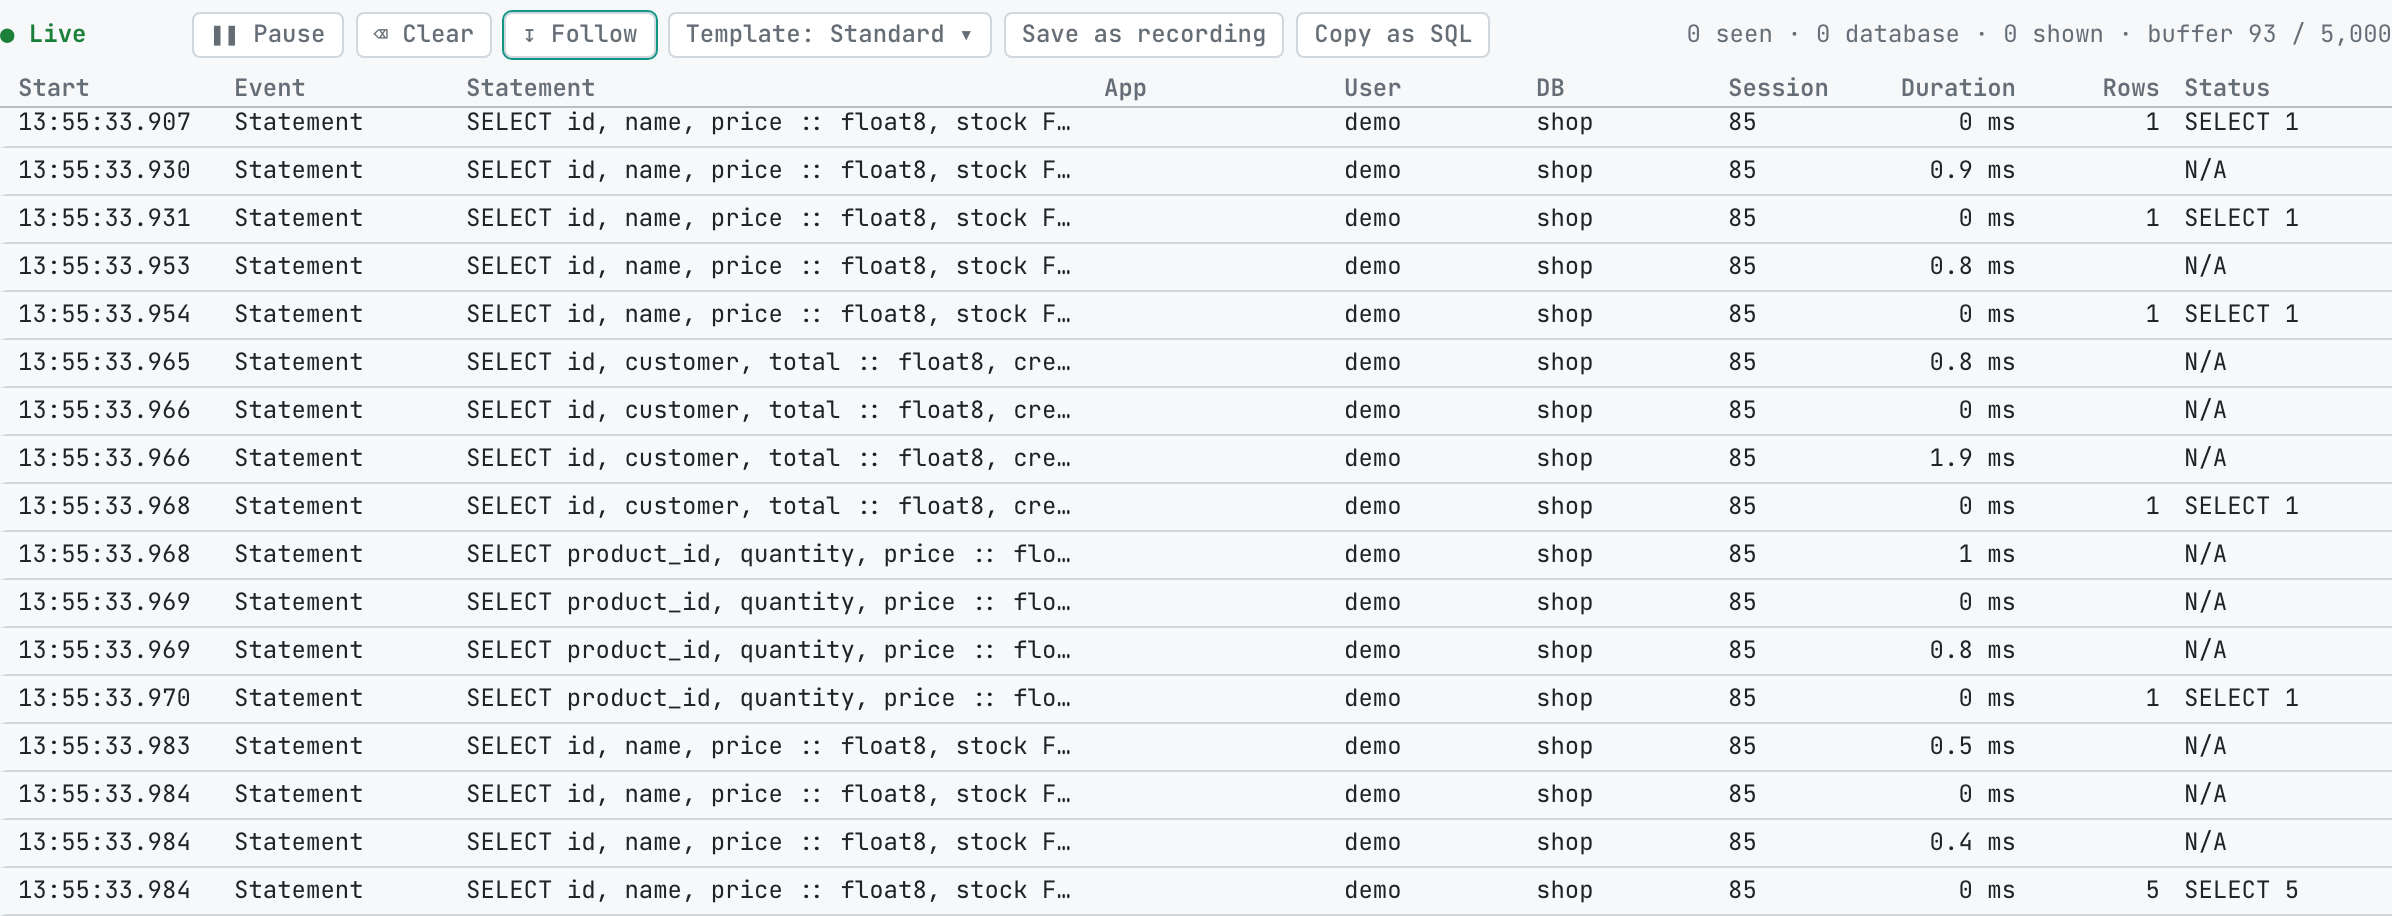
- Live SQL, a lens on the Requests tab since proxymock 2.5.1149, streams statements as they are recorded, like a database profiler: event, statement, application, user, database, session, duration and rows. Templates narrow it to slow statements, errors, cancels and disconnects, logins and logouts, locks, or big results, and Save as recording keeps what it caught. Since 2.5.1154, Copy as SQL copies the rows on screen, or one statement, as a script you can run.
- The detail view of a database call shows the statement with its bound values filled in, how it ended or the error with its name, the login that opened the connection, and whether it ran in a transaction. The Connection tab lists every call on the same connection in order, grouped into transactions.
- Database filters narrow the Requests list by user, database, application, session, transaction, operation, table, statement, error, attention or rows.
Find expensive and repeated statements
The SQL inventory lists every distinct statement in a recording with how often it ran, its latency and the rows it returned, and how many statements each kind of request runs, which is where N+1 loops show up. Run it from Automations in proxymock web, or from the CLI and your agent:
proxymock sql-report --in proxymock/recorded-<timestamp> -o pretty
Link queries to the request that ran them
When your app writes the request's trace id into a SQL comment, proxymock links every statement to the exact request that ran it, even when requests overlap. Each database call shows the request that caused it, and each request shows how many queries it ran. See Link queries to the request that ran them.
Compare two runs
Record before and after a change and compare the two recordings to see new and removed statements, N+1 loops, latency regressions, schema changes and where database time moved. See Compare SQL between runs.
Export runnable SQL
Since 2.5.1152, Export SQL script in the Requests tab's Actions menu, Export as .sql on a call's Connection tab, and proxymock sql-script write the recorded statements as a .sql script in recorded order, with bound values filled in, that psql or mysql can run. Statements whose values were not captured are written commented out.
Mock the database
proxymock mock answers your app's database calls from the recording, so the app runs with no database. Mock a database explains what a SQL mock matches on and how to tune it, and Improve Mock Match Rate with AI fixes the calls that miss.
Load and regression test the database
Replay the recorded statements against a database to find every statement a migration or an upgrade breaks, or with many sessions to load test it. See Load and Regression Test a Database.
Try it
The sqlcommenter lab in mock-lab ships a Postgres recording with overlapping requests, a transaction, a reused prepared statement and requests linked by trace id. make report and make web open it with nothing else running.
In the Speedscale cloud
The same facts and filters work on traffic recorded in Kubernetes. See Databases in the Speedscale cloud.