SQL inventory and sql-report
The SQL inventory answers "what SQL does this app actually run?" from a recording. It groups every Postgres and MySQL call by statement shape, so a query that ran a thousand times with different values is one row, and ranks the statements by how often they ran and how slow they were. It also counts how many statements each kind of inbound request runs, which is where an N+1 loop, one query becoming one query per row, shows up.
The values are masked as ?, so the report holds no recorded data and is safe to paste into a ticket or hand to an AI assistant.
In proxymock web
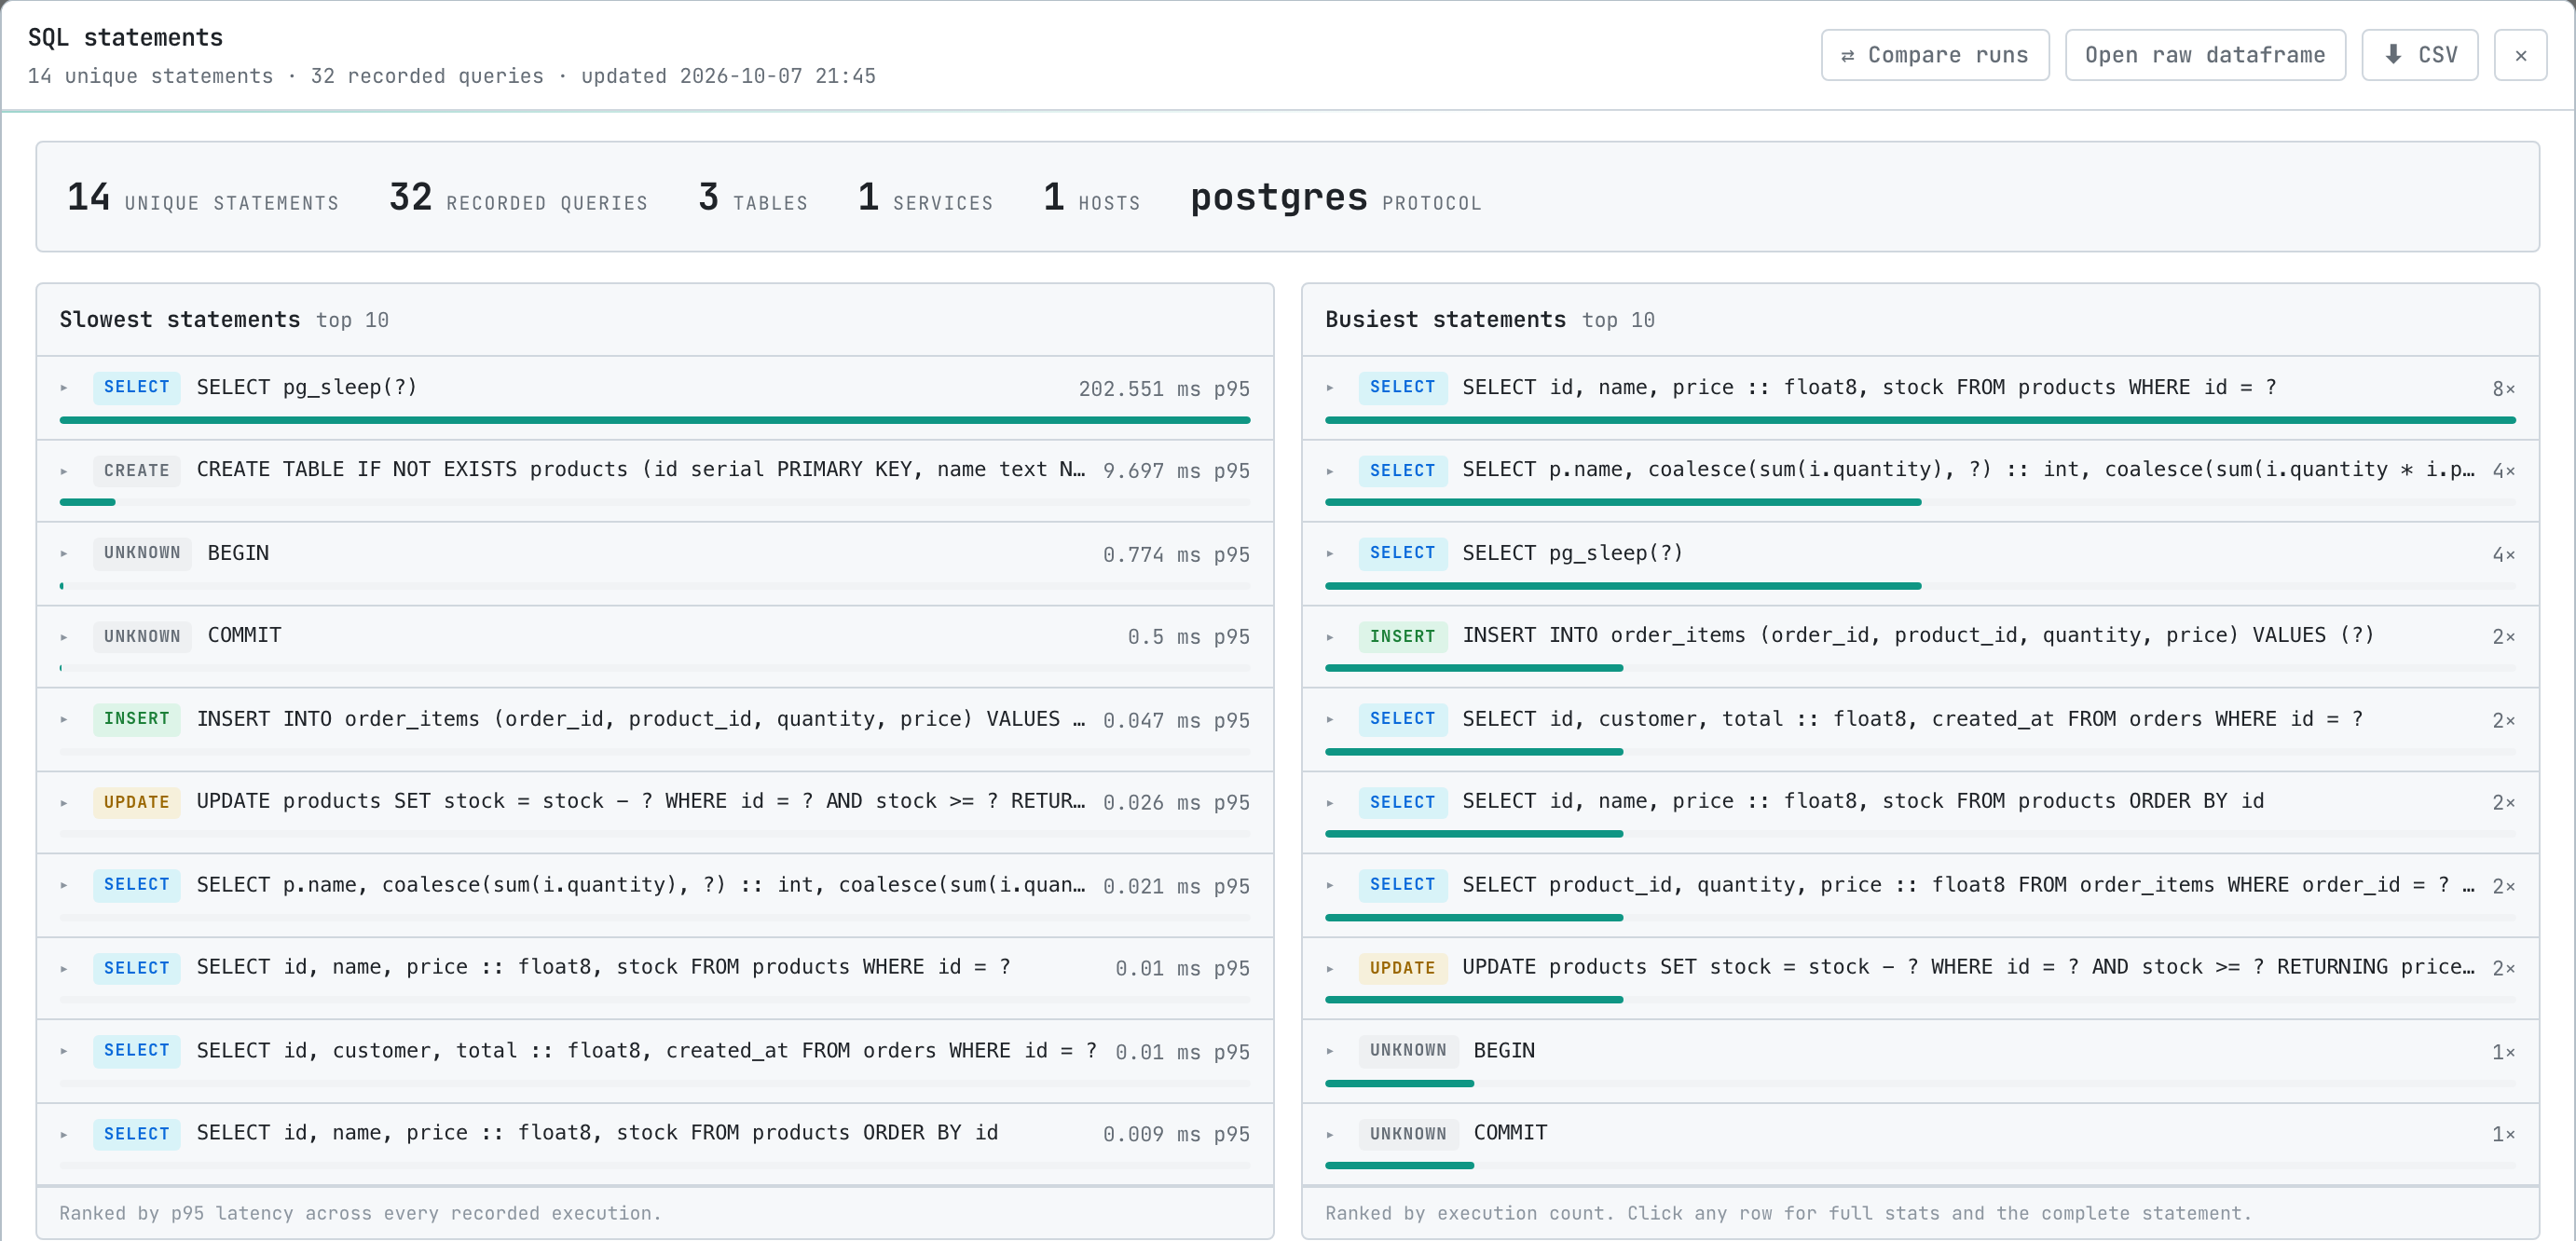
Open the recording in Requests, then choose Actions › Extract SQL statements. The report opens with the counts of unique statements, recorded queries, tables, services and hosts, then:
- Slowest statements: the ten with the highest p95 latency.
- Busiest statements: the ten that ran most often.
- Most rows per call: the ten that return or change the most rows on average, the unbounded queries.
Select any statement for its full SQL and statistics. CSV downloads the whole inventory, and Compare runs compares it with another recording; see Compare SQL between runs.
From the CLI or an AI assistant
proxymock sql-report prints the same inventory. It is also the sql_report tool of the proxymock MCP server, so an AI coding assistant can read it before and after changing your data access code.
proxymock sql-report --in proxymock/recorded-2026-10-07_17-55-30.910016Z -o pretty
From the sqlcommenter lab recording, shortened:
SQL inventory: 14 unique statements across 32 recorded queries.
Tables: order_items, orders, products
Protocols: postgres

Statements (busiest first):
  1. SELECT SELECT id, name, price :: float8, stock FROM products WHERE id = ?
     8× · p95 0.01 ms · avg 0.007 ms · rows avg 1 · max 1 · products
     routes: /products/{id} 8×
  2. SELECT SELECT p.name, coalesce(sum(i.quantity), ?) :: int, coalesce(sum(i.quantity * i.price), ?) :: float8 FROM products p LE…
     4× · p95 0.021 ms · avg 0.013 ms · rows avg 5 · max 5
     routes: /reports/sales 4×
  3. SELECT SELECT pg_sleep(?)
     4× · p95 202.551 ms · avg 202.084 ms · rows avg 1 · max 1
     routes: /reports/sales 4×

Statements per inbound request (18 requests, 31 statements attributed, 20 of them by the trace id in their SQL comment, 1 outside any request):
  1. GET /products/*                          8 req · 1.0/req (max 1)
  2. GET /reports/sales                       4 req · 2.0/req (max 2)
  3. POST /orders                             1 req · 8.0/req (max 8)
  4. GET /orders/*                            2 req · 2.0/req (max 2)
| Flag | What it does |
|---|---|
--in | The recording, or several, to report on |
--baseline | An older recording to compare --in against; see Compare SQL between runs |
-o | pretty, json (the default), yaml or csv |
Read the report
Statements lists each distinct statement with its operation, how many times it ran, its p95 and average latency, the rows it returned or changed, and the tables it touched. Look for:
- A cheap statement that runs far more often than the requests that need it, usually a query inside a loop.
- A statement whose p95 is far above its average: it is usually fast but sometimes waits, often on a lock.
- A statement with a high average row count, which reads more than the page shows.
routes says which endpoints ran a statement, when your app writes its route into a SQL comment, so you can see which page runs the expensive query. It needs proxymock 2.5.1156 or later. See Link queries to the request that ran them to turn tagging on.
Statements per inbound request groups the database calls by the inbound request that ran them and reports the average and maximum per request for each endpoint. An endpoint whose maximum grows with the size of the data is running a query per row. Statements whose SQL comment carries the request's trace id are attributed exactly; the others are attributed by time, and the report says how many of each it counted, because overlapping requests make timing a guess.
With -o json, the inventory is under inventory and the per-request figures under requestLoad, including exactStatements, attributedStatements, ambiguousStatements and unattributedStatements.