Performance Details
The performance dashboard provides useful metrics around SRE golden signals.
Performance Dashboard
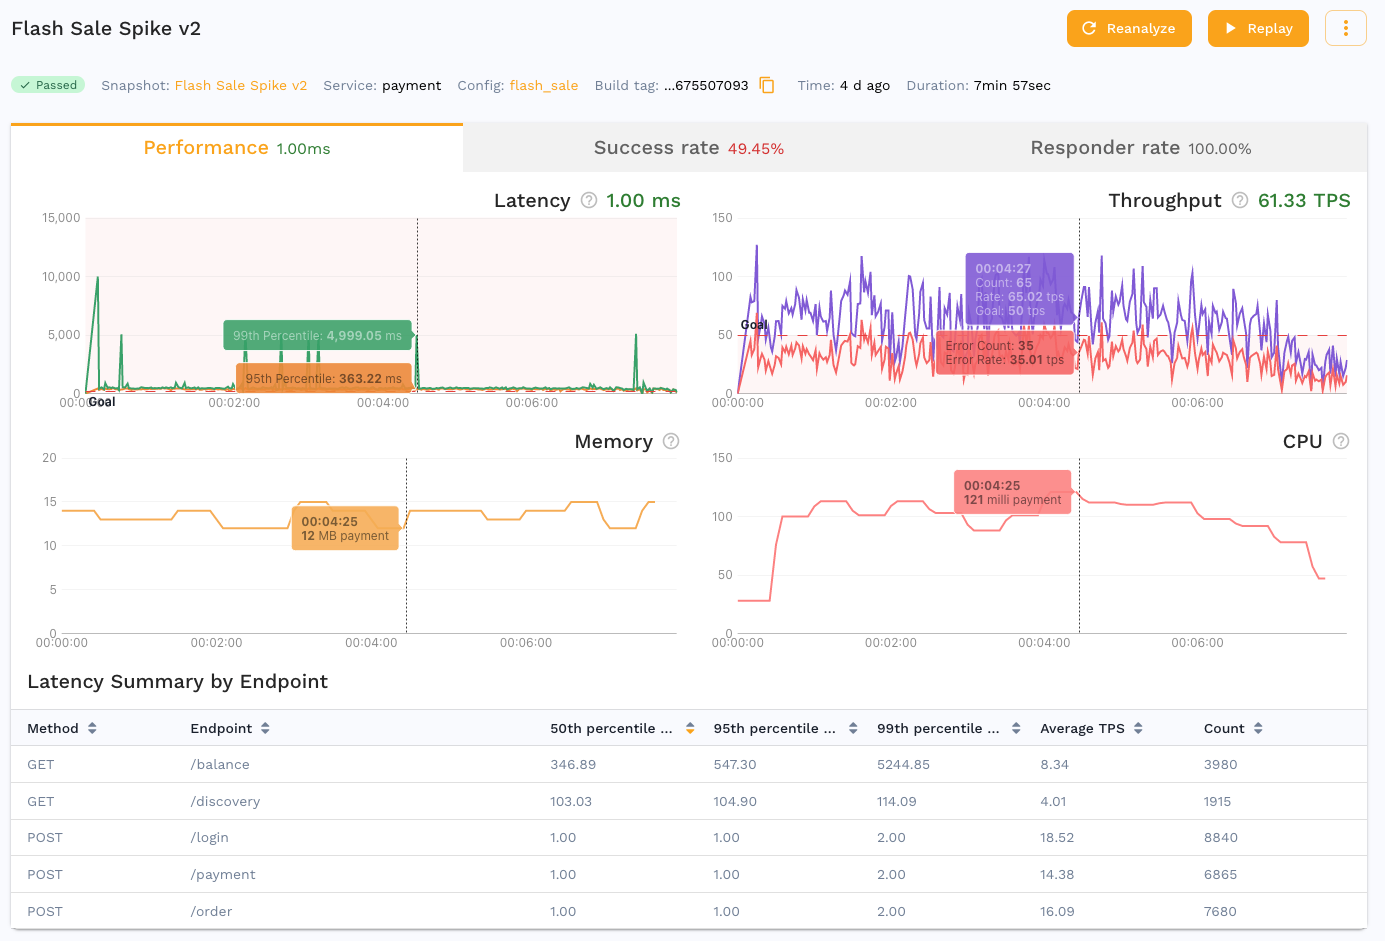
The performance view gives you information at a glance about how your code is performing in comparison to the SRE Golden Signals:
- Latency measured using both average, 95th and 99th percentile
- Throughput measured as traffic over time
- RPS: requests per second
- RPM: requests per minute
- Saturation measured by looking at CPU and Memory from the environment
- Errors there is an entire dashboard devoted to this information
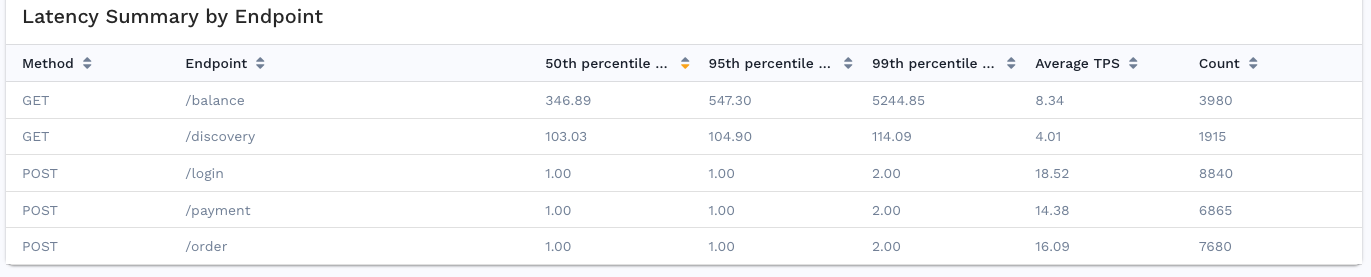
Latency Summary
The bottom of the report performance tab shows a summary of latency by endpoint, aggregated metrics which apply to only a single endpoint. An endpoint is a more generalized view of a URL without the host, port, query parameters, etc. Use this information to identify slow API calls and set goals to fail the report when an endpoint falls outside service level objectives.