Capture Browser Traffic with proxymock
Setup
Prerequisites
- proxymock is installed
- proxymock is initialized with
proxymock init - Firefox or Firefox Developer Edition
proxymock records traffic locally by default. Browser traffic flows through the outbound proxy on port 4140, and proxymock writes request / response pair (RRPair) files under the output directory you choose.
Use a private Firefox window or a separate Firefox profile for recording. Browsers make background calls to many domains, so a clean session keeps the recording easier to inspect and reuse.
Prepare TLS Certificates
Create the proxymock root certificate if it does not already exist:
proxymock admin certs
This creates the local certificate files under ~/.speedscale/certs. On many desktop environments proxymock can add the certificate to the system trust store automatically, but Firefox uses its own certificate store. Import the proxymock CA into Firefox before recording HTTPS sites.
- Open Firefox settings.
- Search for
cert. - Click View Certificates.
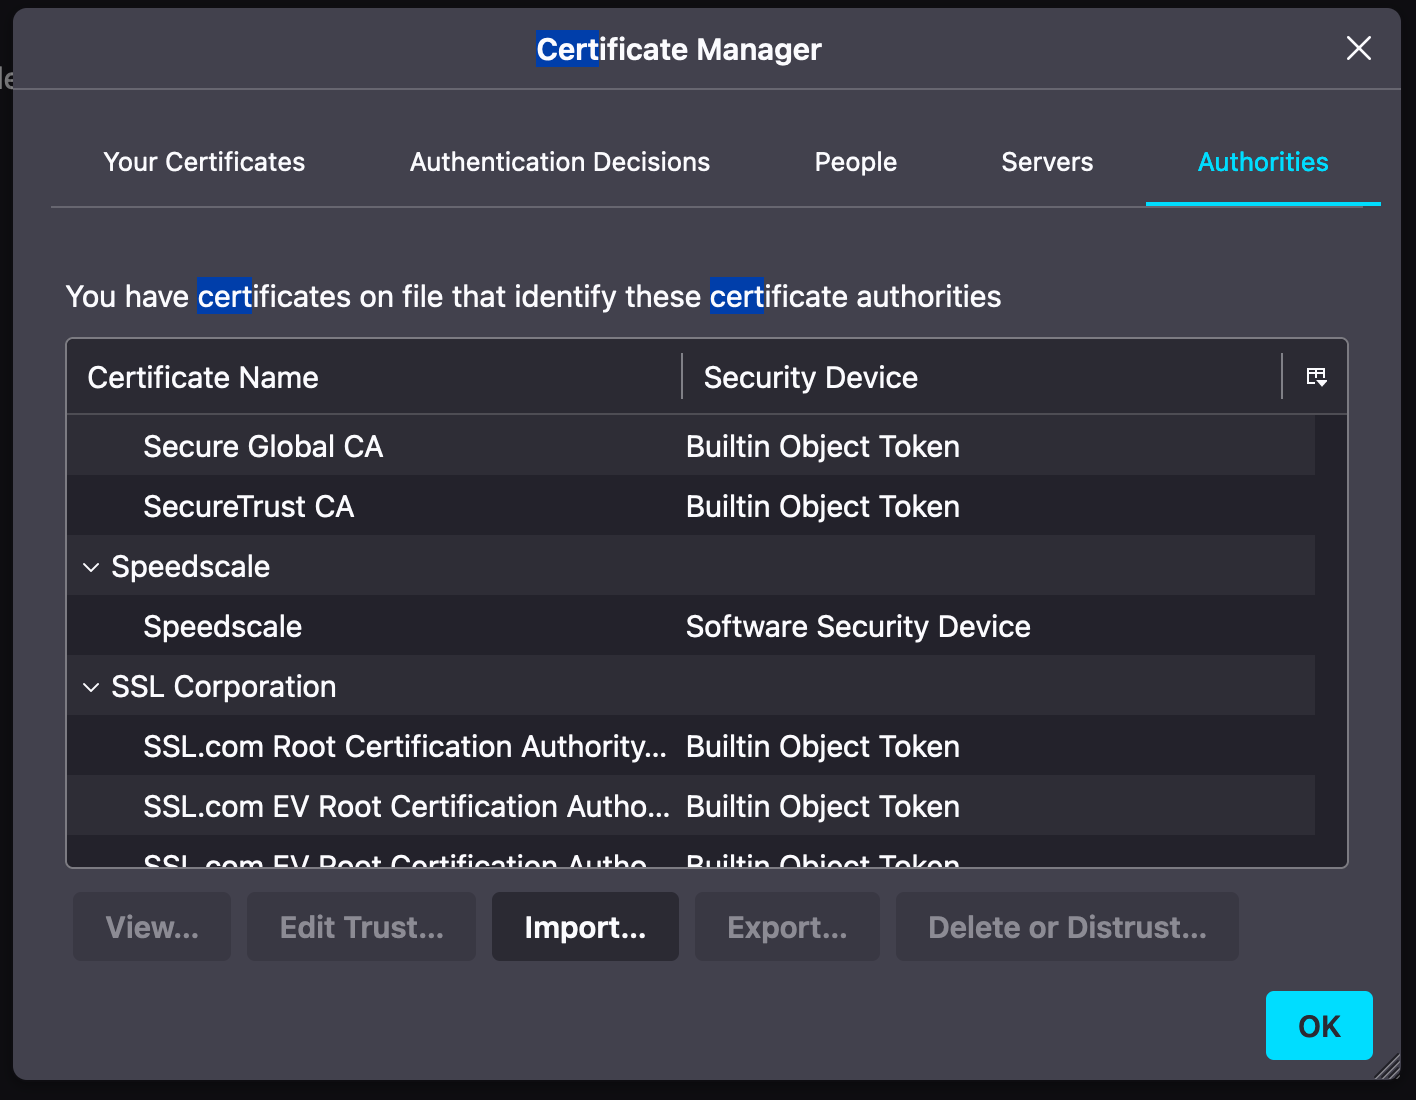
- Select the Authorities tab.
- Click Import.
- Select
~/.speedscale/certs/tls.crt. - Check Trust this CA to identify websites.
Start Recording
Start proxymock in one terminal:
proxymock record --out proxymock/browser-recording
Leave this command running. It starts the outbound proxy on localhost:4140 and writes captured browser traffic to proxymock/browser-recording.
Route Firefox Through proxymock
Configure Firefox to send HTTP and HTTPS requests through the proxymock proxy.
- Open Firefox settings.
- Search for
proxy. - Click Settings in the Network Settings section.
- Select Manual proxy configuration.
- Set HTTP Proxy to
localhostand Port to4140. - Check Also use this proxy for HTTPS.
- Click OK.
Clear Browser Cache
Clear the browser cache before browsing so Firefox makes fresh requests through proxymock.
- Open Firefox settings.
- Search for
cache. - Click Clear Data in the Cookies and Site Data section.
- Select both checkboxes.
- Click Clear.
Browse the Site You Want to Capture
Open the site you want to record and exercise the pages or flows you care about. proxymock writes each captured request and response as an RRPair file under the recording directory.
When you are done browsing, stop the recorder with CTRL-C.
To inspect the recording in the terminal:
proxymock inspect --in proxymock/browser-recording
To inspect it in the local web UI:
proxymock web
You can also inspect the files directly:
find proxymock/browser-recording -name '*.md' | head
Run the Browser Against Mocks
Start the mock server with the recording you just created:
proxymock mock --in proxymock/browser-recording --out proxymock/browser-mock-results
Keep Firefox pointed at localhost:4140 and reload the same pages. Requests that match the recording return local mock responses. Requests that do not match are passed through to the real destination by default and are written under proxymock/browser-mock-results.
If you want the browser to fail instead of passing through unrecorded requests, run:
proxymock mock --in proxymock/browser-recording --no-passthrough
This mode is useful for checking whether a flow is fully covered by the recording. Modern web pages often include analytics, ads, fonts, and background polling, so expect to refine the recording if you use --no-passthrough.
About proxymock Replay
proxymock replay sends recorded inbound requests back to an application. A browser-only recording is outbound browser traffic, so the browser workflow above usually uses proxymock mock rather than proxymock replay.
If you want generated tests for your own application, record the app itself instead:
proxymock record -- <your-app-command>
Then exercise the app through the inbound proxy on port 4143, stop the recorder, and replay those inbound transactions:
proxymock replay --test-against http://localhost:8080
See the proxymock CLI quickstart for the full record, mock, and replay loop.
Cleaning Up
When you are finished, turn off manual proxy configuration in Firefox. If you used a temporary Firefox profile, you can delete it after recording.
Summary
In this guide you learned how to:
- Route Firefox through proxymock
- Record browser traffic locally as RRPair files
- Inspect captured browser requests
- Serve the captured traffic back as local mock responses
- Use app-side recording when you need
proxymock replaytests