Creating Traffic Filters
Filters can be saved from the traffic viewer and then used to prevent traffic from ever reaching Speedscale. Most users will create filters using this UI. Filter rules are stored in Speedscale cloud and applied by the Speedscale Forwarder. Once a filter is applied to the forwarder, no traffic will leave your network that is prohibited by the filter.
Simple filters can be used anywhere but complex filters cannot be used in Traffic Viewer. You may notice that some filters like HTTP Headers are available in the Filter Rule editor but not in the traffic viewer. This is due to a temporary backend constraint that will get resolved in a future version.
Here's how you create and apply them:
Create Filters From Dashboard
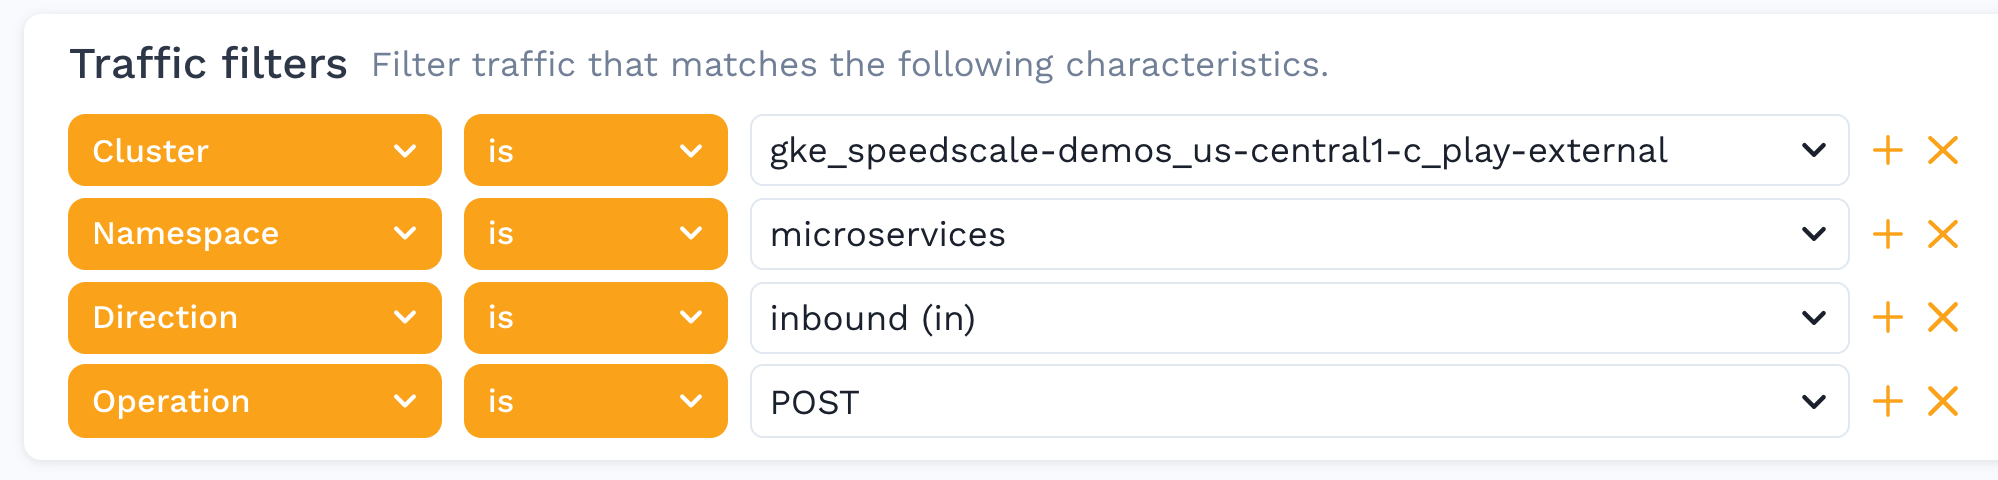
- Open the Traffic Viewer and select your service
- Apply filters to narrow down the traffic to only the request/response pairs that you want to allow.
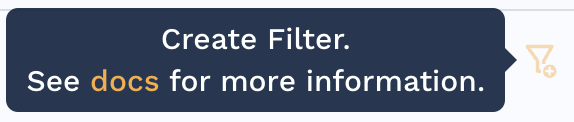
- Click the Create Filter button in the top right of the filter section:
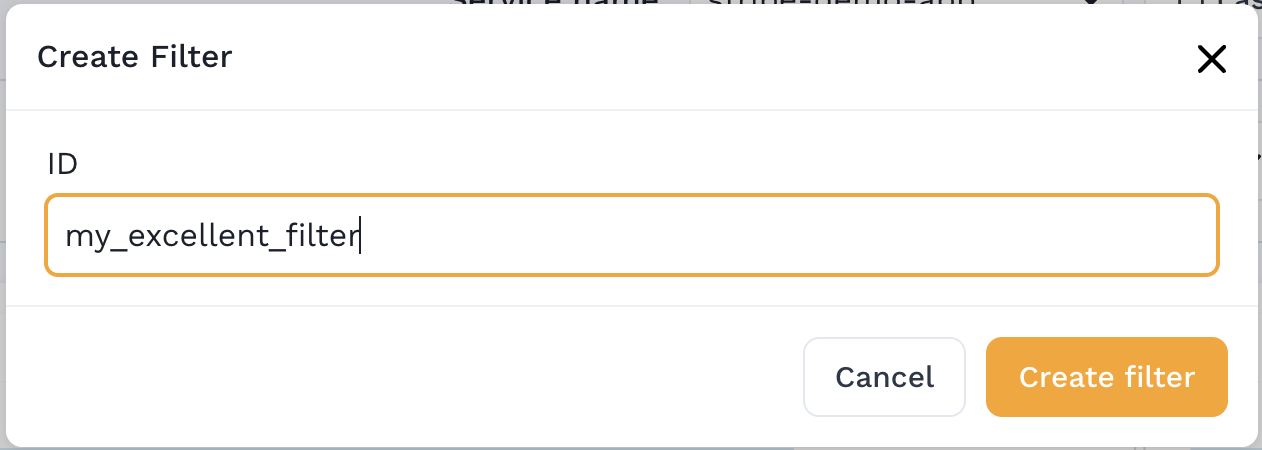
- Give the filter a unique ID (no spaces) - make sure to remember it.
Create Filters with the CLI
Prerequisites
Pull Filter Using the CLI
You can pull your filter using speedctl.
speedctl pull filter my_excellent_filter
By default, your filter will be download to ~/.speedscale/data/filters/my_excellent_filter.json.
After editing the filter, you can use push command to update filter in speedscale cloud.
speedctl push filter my_excellent_filter
Filter files contain both a human readable query string and an internal JSON representation. You can ignore the internal JSON representation. It will update automatically when you modify the query string.
Edit the Filter Query String
Speedscale employs a filter syntax that should be familiar to users of observability and monitoring tools. The syntax is a simple combination of operators and grouping with parentheses. The following operators are supported:
IS
NOT
CONTAINS
NOT CONTAINS
REGEX
between each filter criteria should be an AND or OR. Each set of filter rules should be separated with parentheses even if there's only one filter rule. If there's more than one rule for a key (namespace) they should be grouped together in a single set of parentheses.
This is a full example of a query:
(header[User-Agent] CONTAINS "ELB\-HealthChecker/" OR header[User-Agent] CONTAINS "Prometheus/" OR header[User-Agent] CONTAINS "apm-agent-") OR (location REGEX "^\/users\/([0-9]*)$") OR (timerange IS "2023-10-26T02:28:54Z" "2023-10-26T02:28:54Z")
As you can see, all header filters are grouped together. And even though for timerange we only have a single filter, we still wrap it inside parentheses.
The following keywords can be used in your filter query:
| Keyword | Description | Example |
|---|---|---|
| cluster | kubernetes cluster | cluster NOT qa-test-1 |
| command | request command | command IS POST |
| direction | ingress(IN) or egress (OUT) | direction IS IN |
| header[{key}] | HTTP Header Key=Value | header[User-Agent] CONTAINS "Prometheus" |
| l7protocol | protocol type | l7protocol NOT CONTAINS HTTP |
| location | location/endpoint | location REGEX "^(.*)health$" |
| namespace | kubernetes namespace | namespace IS default |
| networkaddr | network address/host | networkaddr NOT grpc-server:80 |
| req_json[{key}] | check request body against a json key/value | req_json[foo] IS bar |
| req_xml[{key}] | check request body against an xml key/value | req_xml[foo] IS bar |
| req_soapxpath[{key}] | check request body against a soap XPath | req_soapxpath[foo] IS bar |
| req_xpath[{key}] | check request body against an XPath | req_xpath[foo] IS bar |
| sample | keep a deterministic fraction of traffic, written as keep/out_of (see Sampling) | sample IS "1/5" |
| service | service name | service CONTAINS frontend |
| session | session (if set) | session IS "JWT:abc123" |
| snapshot | snapshot ID (if present) | snapshot IS 88e9b593-b617-44a2-9eaf-06f76605e941 |
| source | traffic source (goproxy, snapshot, responder, generator, notebook) | source IS goproxy |
| status | status code | status IS 404 |
| tag[{key}] | tag value | tag[testReportId] IS 88e9b593-b617-44a2-9eaf-06f76605e941 |
| tech | detected tech (primary) | tech NOT CONTIANS "Google Spanner" |
| timerange | within a time range (RFC3339 format) | timerange IS "2023-10-26T02:28:54Z" "2023-10-29T04:28:54Z" |
| url | URL | url IS "/healthz" |
| uuid | identify a specific RRPair by UUID | uuid IS 88e9b593-b617-44a2-9eaf-06f76605e941 |
You can now use the following command to update your filter:
speedctl push filter my_excellent_filter --query-string '(header[User-Agent] CONTAINS "ELB\-HealthChecker/" OR header[User-Agent] CONTAINS "Prometheus/" OR header[User-Agent] CONTAINS "apm-agent-") OR (timerange IS "2023-10-26T02:28:54Z" "2023-10-26T02:28:54Z")'
You can also create a brand new filter using the put command.
speedctl put filter --id my_new_excellent_filter --query-string '(header[User-Agent] CONTAINS "ELB\-HealthChecker/" OR header[User-Agent] CONTAINS "Prometheus/" OR header[User-Agent] CONTAINS "apm-agent-") OR (timerange IS "2023-10-26T02:28:54Z" "2023-10-26T02:28:54Z")'
Sampling a large selection
When a selection of traffic is larger than you need — for example, bigger than a single snapshot can hold — the sample keyword keeps a deterministic, evenly distributed fraction of it instead of the whole set. Write the value as keep/out_of:
sample IS "1/5"keeps one in every five request/response pairs (20%).sample IS "1/10"keeps one in ten (10%).
Sampling is session-atomic by default: every request/response pair that shares a session is kept or dropped together, so a sampled result still contains coherent, replayable sessions rather than a scatter of orphaned calls. Sessions are keyed on the session identifier when present, falling back to the pair's UUID.
The selection is deterministic — the same fraction always picks the same pairs — so sample composes with your other filters and with paging in the Traffic Viewer without shifting rows between pages. In the dashboard Traffic Viewer the same control is exposed as the Sampled filter, where you can choose a percentage (for example, Keep 20% — 1 in 5) or enter your own.
To sample per request/response pair instead of per session, key the value on rrpair:
sample[rrpair] IS "1/5"
Apply the filter
The filter must be applied to take effect.
- GitOps
- speedctl
Change the filterRule configured in your values.yaml file of the operator helm chart to the name of your filter. After updating or overriding the value, then run the helm upgrade command for the changes to take effect.
Apply your filter to one of your clusters with speedctl infra operator patch --cluster my-cluster --filter-rule my_excellent_filter.
You can list your clusters with speedctl infra inspectors -o pretty.
Troubleshooting
Check these items if the filter is not being applied correctly.
- Ensure the filter rule exists on the filter page or with
speedctl get filters -o pretty - If you have modified the filter rule from the CLI with
speedctl pull filter-ruleensure it is pushed back to the Speedscale cloud withspeedctl push filter-rule - Verify the setting directly in your cluster with
kubectl -n speedscale get cm speedscale-forwarder -o jsonpath='{.data.SPEEDSCALE_FILTER_RULE}'
Remember, if you get stuck you can get help quickly on the Speedscale slack