Cluster Map
The cluster map is a visual representation of your Kubernetes infrastructure that shows namespaces, deployments, services, and the traffic flowing between them. It gives you a real-time view of how your services communicate, making it easy to identify dependencies, spot traffic patterns, and launch captures or replays directly from the map.
Accessing the Cluster Map
Navigate to the Infrastructure section in the Speedscale dashboard and select a connected cluster. The cluster map is available as a view alongside the existing Cluster Inspector tabular interface.
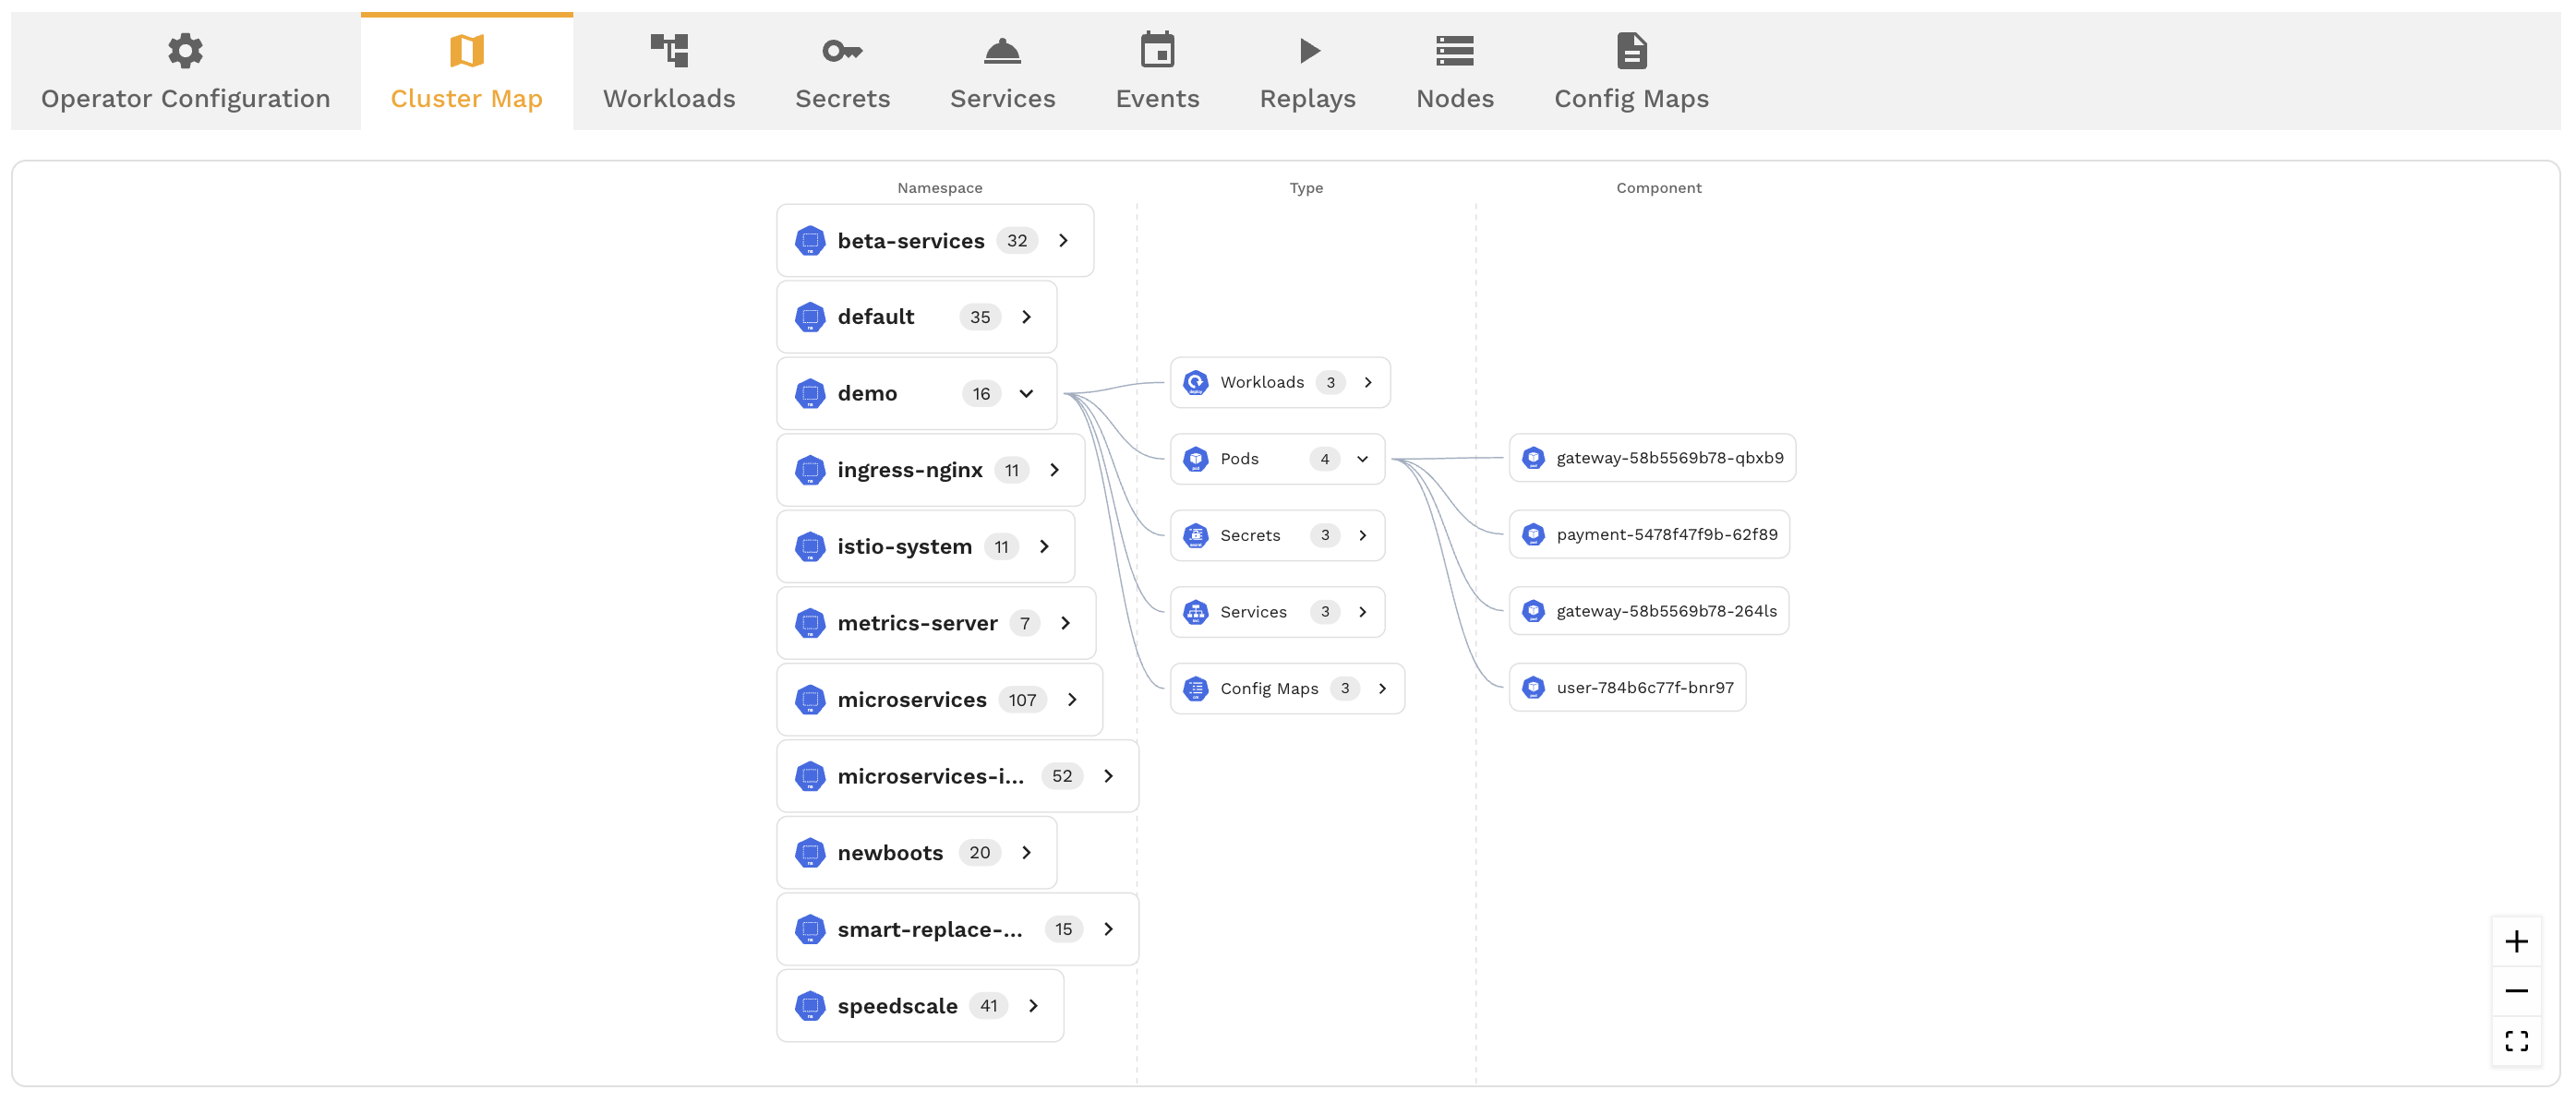
Reading the Map
The cluster map displays your infrastructure as an interactive graph:
- Namespaces are shown as containing boundaries that group related workloads
- Deployments and pods appear as nodes within their namespace
- Services are shown with their associated endpoints
- Traffic edges are lines connecting nodes, representing observed traffic flow between services
The thickness and color of traffic edges indicate volume and health:
- Thicker lines represent higher traffic volume
- Green edges indicate healthy traffic (low error rates)
- Red or orange edges indicate elevated error rates on that path
Filtering the Map
For large clusters, the full map can be noisy. Use filters to focus on what matters:
- Namespace filter — show only workloads in specific namespaces
- Label filter — filter by Kubernetes labels (e.g.,
team=payments,env=staging) - Service filter — search for a specific service by name to center the view on it and its immediate dependencies
Clicking Into a Node
Click on any node in the map to see details:
- Workload metadata — name, namespace, labels, replica count
- Traffic summary — inbound and outbound request rates, error rates, and latency
- Capture status — whether the workload is currently being captured (via sidecar or eBPF)
- Recent snapshots — snapshots that include traffic from this workload
Launching Actions from the Map
The cluster map isn't just for viewing — you can take action directly:
- Start a capture — click a workload node and enable traffic capture without leaving the map
- Launch a replay — select a workload and kick off a replay using an existing snapshot
- Open in Traffic Viewer — jump directly to the Traffic Viewer filtered to a specific service
This makes the cluster map a natural starting point for exploratory testing workflows: see your services, pick one, capture traffic, and replay it.
Relationship to the Cluster Inspector
The cluster map and the Cluster Inspector show the same underlying cluster data in different ways:
- Cluster Inspector — tabular, detail-oriented. Best for managing sidecars, viewing logs, inspecting configuration
- Cluster Map — visual, topology-oriented. Best for understanding service dependencies and traffic patterns
Both are available from the same Infrastructure section and complement each other.
Tips
- Start with a namespace filter when exploring large clusters — showing everything at once can be overwhelming
- Use the cluster map to identify services with unexpected dependencies before setting up captures
- The traffic edges update as new traffic is observed, so leave the map open during a test to watch traffic flow in real time
Service map and workload context
The Infrastructure Service Map combines observed service dependencies and technology icons. It complements the Kubernetes resource map: a detected technology describes observed traffic and does not itself prove that every operation is supported for replay.
Open a workload to inspect its cluster and node placement, available logs and Kubernetes events, and capture health. Use node placement to investigate whether affected workloads share a node. The workload view is also a useful starting point for opening its traffic and checking downstream dependencies.
The account Usage tab includes cluster capacity when the connected components report it. Capacity describes the cluster resources reported to Speedscale; it is separate from CPU and memory consumed during an individual replay. For replay measurements, use the report's Performance Details.