Compare RRPairs Across Datasets
Speedscale lets you compare request/response pairs across two datasets — snapshots, replay reports, or mock recordings — to identify exactly what changed. This is useful for validating deployments, comparing environments, and catching regressions before they reach production.
Use Cases
- Before/after a deploy — capture traffic before and after a code change, then compare to see what responses changed
- Staging vs. production — compare the same requests across environments to verify staging behaves like production
- Version comparison — replay the same snapshot against two versions of a service and diff the results
- Mock validation — compare mock responses against real service responses to verify mock accuracy
Comparing in the Dashboard
Selecting Two Datasets
- Navigate to the Snapshots or Reports section in the dashboard
- Select the first dataset (your baseline)
- Select the second dataset (the one you're comparing against)
- Click Compare to open the comparison view
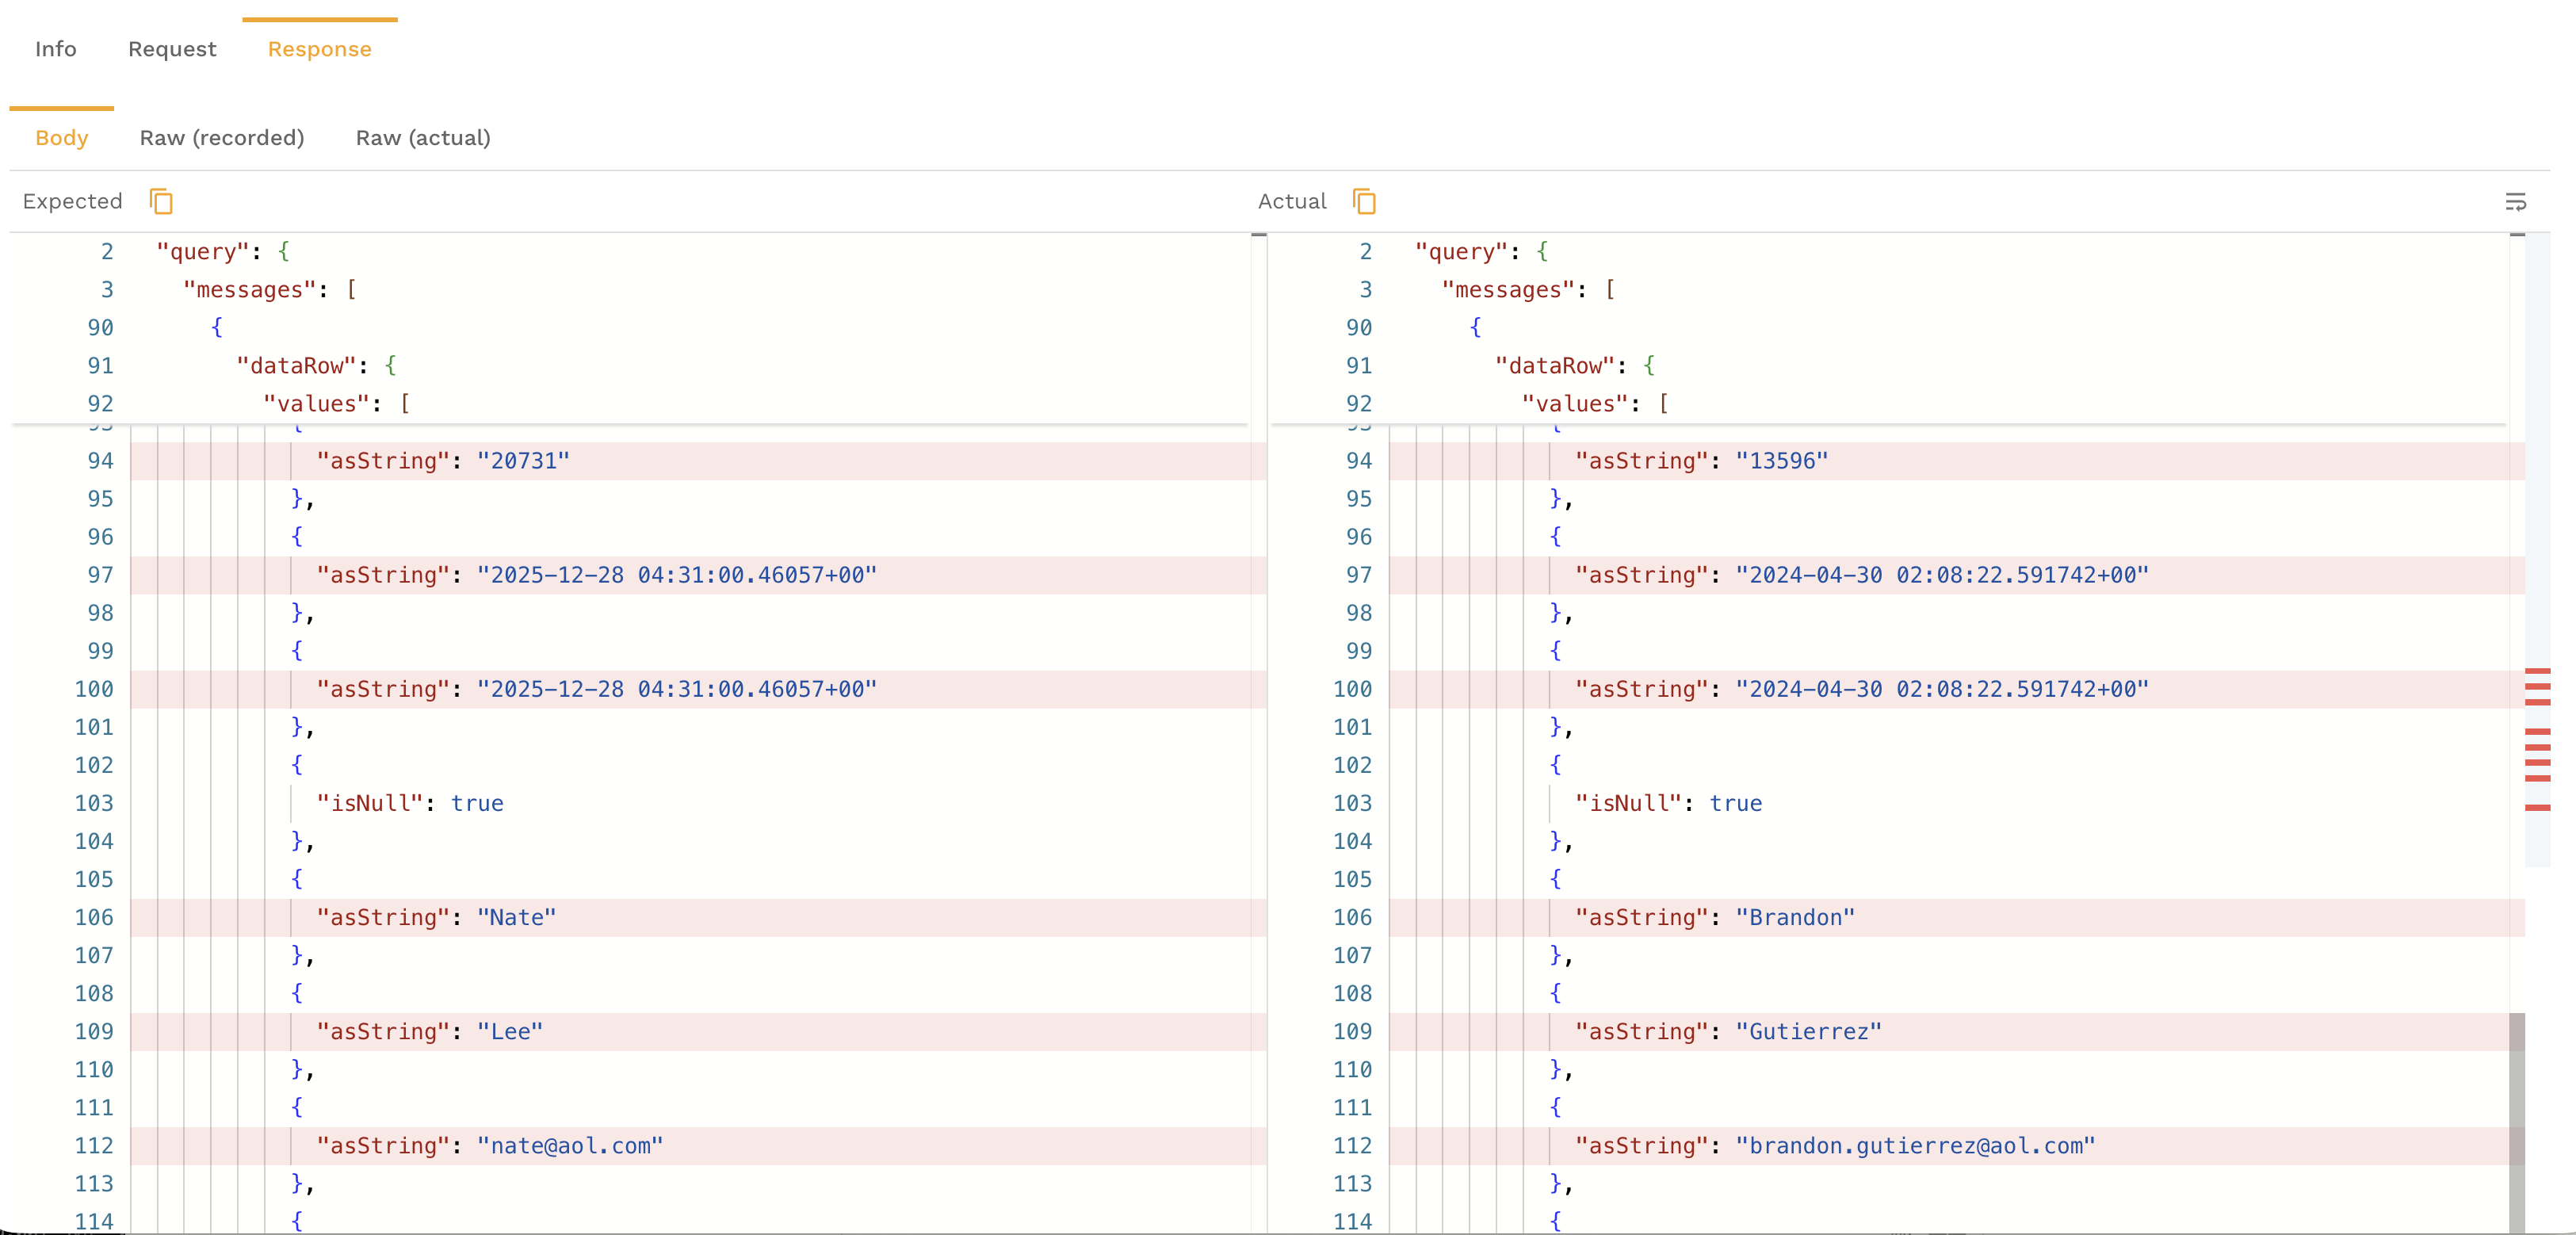
Reading the Diff View
The comparison view shows RRPairs side by side with differences highlighted:
- Status code changes — highlighted when the response code differs between datasets
- Header differences — added, removed, or modified headers are called out
- Body differences — field-level diffs show exactly which values changed in the response body, with additions in green and removals in red
- Latency differences — response time changes are shown so you can spot performance regressions
Filtering to Changed RRPairs
By default, the comparison shows all RRPairs. Use the filter controls to narrow the view:
- Show only changed — hide matching RRPairs and focus on differences
- Filter by change type — show only status code changes, body changes, or header changes
- Filter by endpoint — focus on a specific API path
Comparing via the CLI
The proxymock CLI includes a files compare command for diffing RRPair files locally when they share refUuid relationships - for example, traffic recorded with proxymock and the replay results generated from it:
proxymock files compare --in recorded/ --in replayed/
This compares RRPair files from the supplied directories or files and exits non-zero when differences are found. Add more verbosity if you want a more detailed diff:
# Compare recorded traffic and replay results with very verbose output
proxymock files compare --in recorded/ --in replayed/ -vvv
Interpreting Diffs
When reviewing comparison results, focus on these categories:
Status Code Changes
A status code change (e.g., 200 → 500) is the most obvious regression signal. Investigate these first.
Body Field Changes
Not all body changes are regressions. Common expected changes include:
- Timestamps — naturally differ between runs
- Request IDs and correlation IDs — unique per request
- Ordering — array elements may appear in a different order
If you expect noisy fields such as timestamps or request IDs, normalize that data before comparing, or use the field ignore controls in the dashboard.
Latency Changes
A significant latency increase on a specific endpoint may indicate a performance regression, a slower dependency, or infrastructure differences between the two environments.
Header Changes
New or removed headers can indicate middleware changes, proxy configuration differences, or framework upgrades.
Exporting a Comparison Report
From the dashboard comparison view, click Export to download the comparison as a report. The export includes:
- Summary statistics (total RRPairs, changed count, change rate)
- Per-endpoint breakdown of changes
- Full diff details for each changed RRPair
This is useful for attaching to pull requests, sharing with QA, or archiving for compliance.