Traffic View
Speedscale replicates environments by replicating traffic. Selecting what traffic to replicate allows you to select which databases and endpoints will be included in the environment snapshot. By filtering the traffic viewer, you are selecting which set of inbound and outbound peers will be present when Speedscale replicates the environment. For instance, if Speedscale sees even one Postgres SELECT statement in traffic viewer then it will stand up a Postgres mock with that query loaded. The Speedscale traffic viewer allows you to inspect inbound and outbound transactions. The amount of data can become overwhelming and so you will want to filter down the window of visibility. When creating snapshots, the filter will also determine what parts of the environment are replicated.
Keep in mind that the Traffic Viewer continually refreshes. In logging tools this is called a "live tail" and means by default new traffic will appear at the top of the list. Traffic Viewer is not perfectly real time but generally observed requests show in the UI within a minute or less.
A filter query string determines which traffic is included in a view (or snapshot). The filter query string follows a fairly straightforward filter syntax that you can learn about in the guide. As the traffic viewer view changes, the underlying filter query string also changes.
Request Response (RRPair) Details
Clicking on any individual row reveals a Request / Response Pair. This could be for an inbound transaction to the service, or even a call from the service to a downstream system, even if it uses TLS. The following information is shown in the view:
- Info section includes high level details like response code, duration, URL, etc.
- Request section includes the Headers and Body that were sent
- Response section includes the Headers and Body that were received
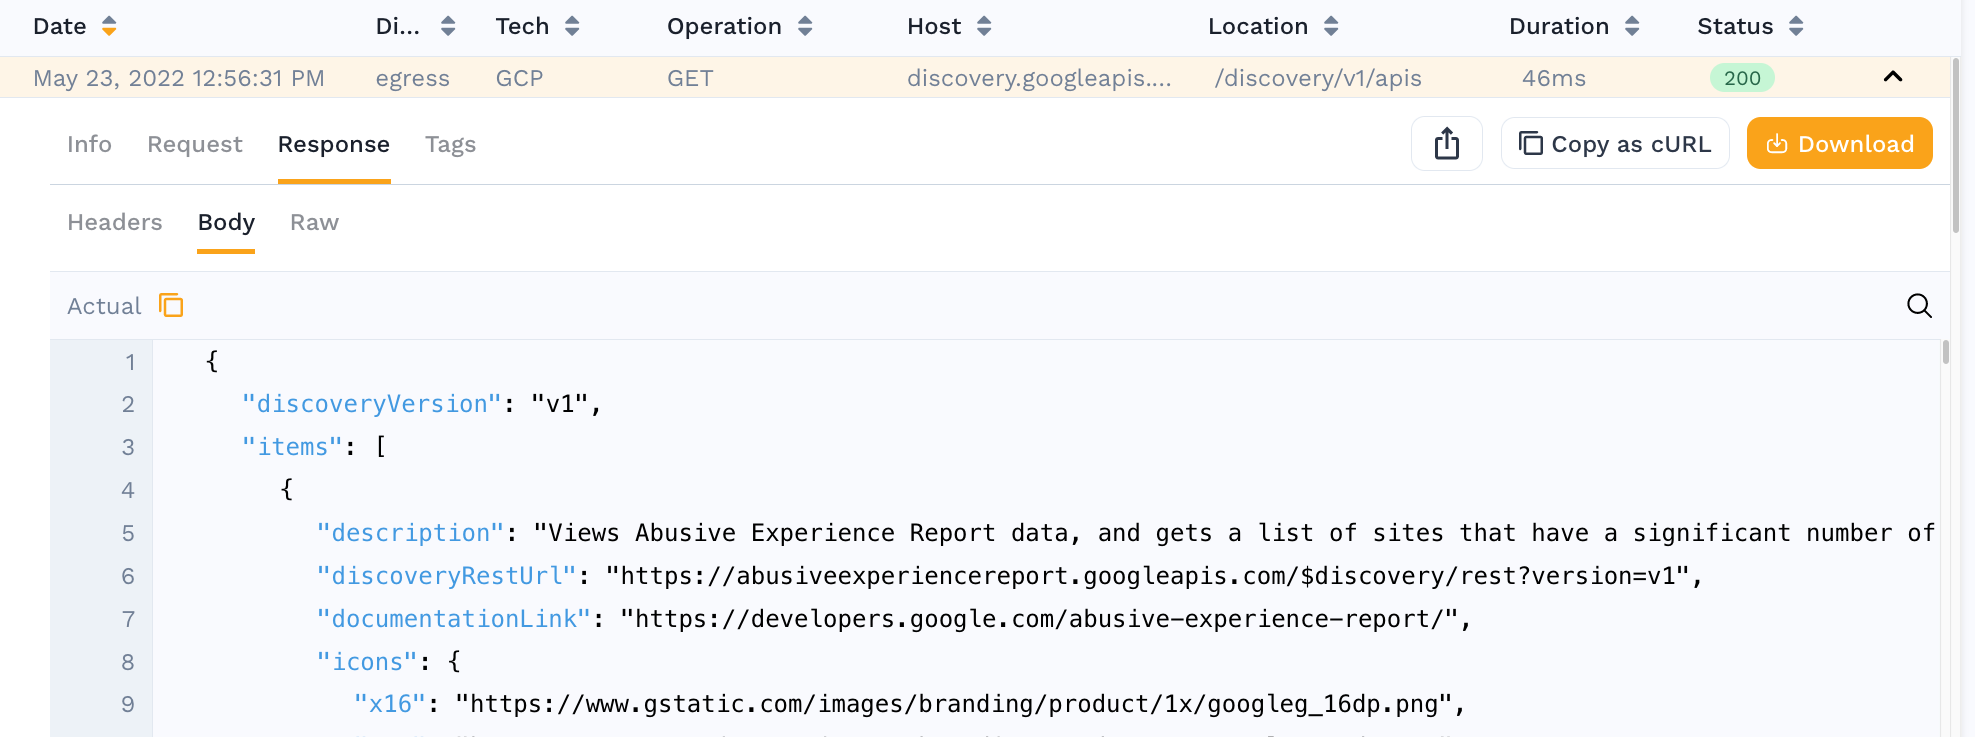
Now that you understand how to view an individual request, you will want to start working with groups of traffic and that means filters.
Additional tabs may appear with analysis or potential actions for the specified RRPair. For example, Speedscale automatically decodes JWT headers and displays details in the Auth tab.
Simple Filters
When getting started with the traffic viewer, you'll want to select three key filter criteria:
- Time range - Speedscale defaults to 15 minutes but this can stretch for days or even weeks.
- Services - Define the services to be replicated. Services are the containers you will be performance testing, etc. There can be more than one in a single snapshot
- Inbound and outbound dependencies - If you'd like to view/replicate a frontend and backend service, that's ok. But you don't need to include things like monitoring systems and heartbeats.
As you use cases get more advanced you can explore more complex filters, but these are the most important to get started with.
Editing simple filters can be accomplished in different three ways:
- Filter editor - Click the Filters bar at the top to open the editor. Click a single filter in the bar to open the editor on that filter. See The filter editor below.
- Left sidebar - Common filter criteria can be modified using left sidebar checkboxes.
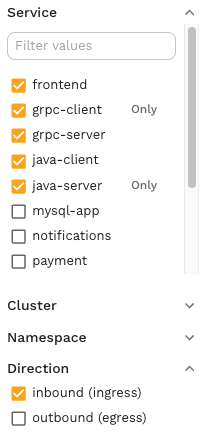
The sidebar narrows from cluster to namespace to service. Checking a cluster limits the Namespace and Service lists to what runs in it, and unchecks any service from another cluster (click Undo in the notice to keep them).
With a cluster or namespace checked and no single service picked, the page shows traffic for every service in it, and the Service list shows them all checked. Uncheck a service to leave it out.
Each open sidebar section has All and Clear next to its title. All checks every value the section's search box leaves visible, so you can search for q-01 and check every match at once. The count next to the title, such as "3 of 12", shows how many values are checked.
- Shortcuts - Some data can be quickly filtered on. Look for the small magnifying glasses next to some fields.

The filter editor
Watch how to filter by service and endpoint, inspect a request, and save the filtered traffic as a snapshot.
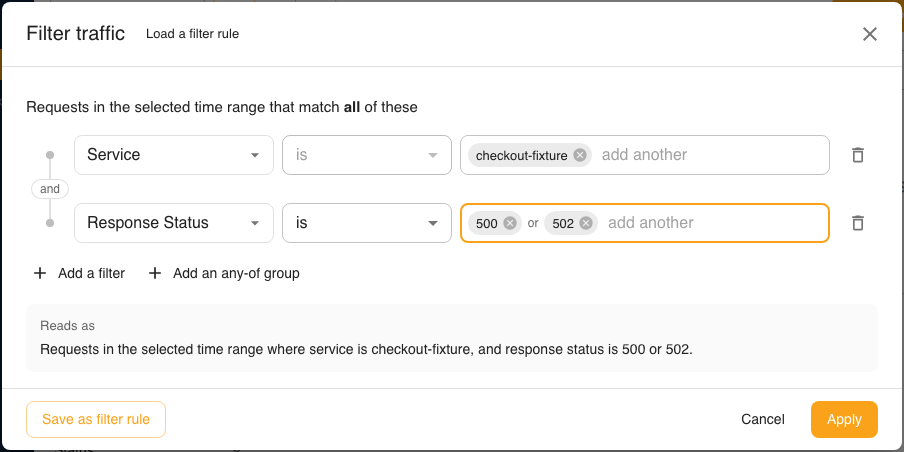
The filter editor reads like a sentence: "Requests in the selected time range that match all of these", followed by one row per filter. The same editor is used everywhere you pick a subset of traffic, including snapshots, reports, filter rules, transform chains and test configs.
Each row is one field, a comparison and one or more values. Add a value by typing it and pressing Enter, or by picking a suggestion. Several values in one row read as "Service is orders or payments": "is" matches any of the values, and "is not" or "doesn't contain" exclude all of them. For "contains", click the word between two values to switch between "or" and "and".
Click Add a filter to pick a field. The field list is searchable and grouped by where the value comes from: where the request ran, the request, the response, identity, replay and testing, and database. Each field offers only the comparisons it supports. For example, Service can only be matched with "is", and Full Text can't be negated.
The word on the left between two rows says how they combine. On the Traffic page every row has to match, because the page also applies its time range. To match "this or that", click Add an any-of group and add the alternatives to the group, for example "Response Status is 500" or "Duration is more than 2000 ms". A group has its own all or any choice. Where nothing else applies, such as a filter rule, a test config scope or a chaos rule scope, the top line also lets you choose between all and any, and clicking the word between two rows switches it.
Transform chains, runtime variables and DLP rules store a flat list of filters that all have to match. Their editor has no groups, and an "is" row takes one value.
Below the rows, Reads as describes the whole filter in plain language. Rows that are still missing a value are left out until you finish them. Cancel discards your changes, and Apply applies them. Removing every filter and clicking Apply shows all traffic again.
Complex Filters
Certain complex filter criteria are permitted when creating a snapshot but not in the Speedscale UI. Generally this involves whole-document payload comparisons like requestBodyJson. Request and response body filters on a single key, in JSON, XML, XPath or SOAP form, are available in the filter editor as Request Body and Response Body. Edit the remaining criteria directly in the filter query string. You may also notice complex JSON representations of filters hidden in the UI. This is the internal Speedscale filter presentation and is not typically edited by users. If you're curious about complex filters you can learn more in this guide.
Saving Traffic
Clicking the Save button at the top of the Traffic Viewer will cause the current view to be stored for future use. That could mean it's a section of traffic you want to replay or simply view later. Saving a snapshot does not cause additional ingest usage on your account. You should feel free to save snapshots without concern.
Traffic filters can also be saved for use as forwarder filters or snapshot criteria by clicking Save as filter rule in the filter editor. A filter rule can compare only one field inside each group, so the button is disabled while a group mixes fields. The Traffic Viewer also employs URL deep links which means you can copy/paste the URL bar in your browser to share a view.
Resending Requests
You can resend any captured request directly from the traffic viewer. Click on an RRPair to open the detail view, then click the Resend button to open the resend panel. From there you can modify headers, body, and URL before sending. The response appears alongside the original for easy comparison. See the full Resend RRPair guide for details.
Full-Text Search
The traffic viewer supports full-text search across request and response content. Use the search bar to find specific strings in URLs, headers, and bodies across all visible traffic. This is particularly useful for tracking down requests containing specific tokens, error messages, or field values.
Request and Response Editor
The RRPair detail view uses a Monaco-based code editor (the same editor that powers VS Code) for displaying request and response bodies.

The editor provides:
- Syntax highlighting for JSON, XML, HTML, and other content types
- Code folding to collapse and expand nested structures
- Keyboard shortcuts — standard editor shortcuts like
Cmd/Ctrl+Ffor find,Cmd/Ctrl+Gfor go to line - Word wrap toggle for long lines
Managing Snapshot Size
Snapshots do not have a fixed size limit but extremely large snapshots can time out because they take too much time to process. Beyond warnings in the UI, you'll know this is happening because your snapshot will process for a number of hours and suddenly stop with an error.
Speedscale cloud is designed to horizontally scale analysis jobs but all systems have configuration limits. If your snapshot creation is timing out, follow the procedure below to chop it down to a more manageable size. Generally speaking, snapshot size has no limit but practically speaking snapshots over a few gigabytes become unmanageable simply because files that large take time to move. To handle snapshot creation timeouts you can follow the following procedure:
- Save a snapshot for a minimal amount of time like 15 minutes (the default)
- Once this is complete, open the snapshot's More actions menu and choose Inspect data > View tags. Look for the raw file size.
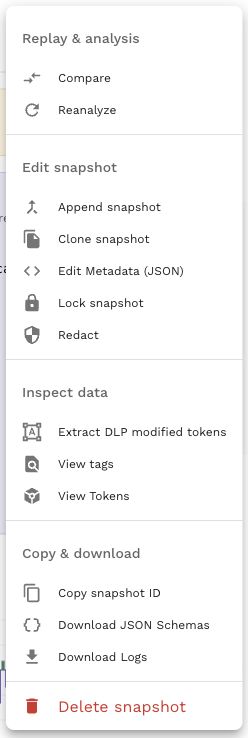 Open the action menu image full size
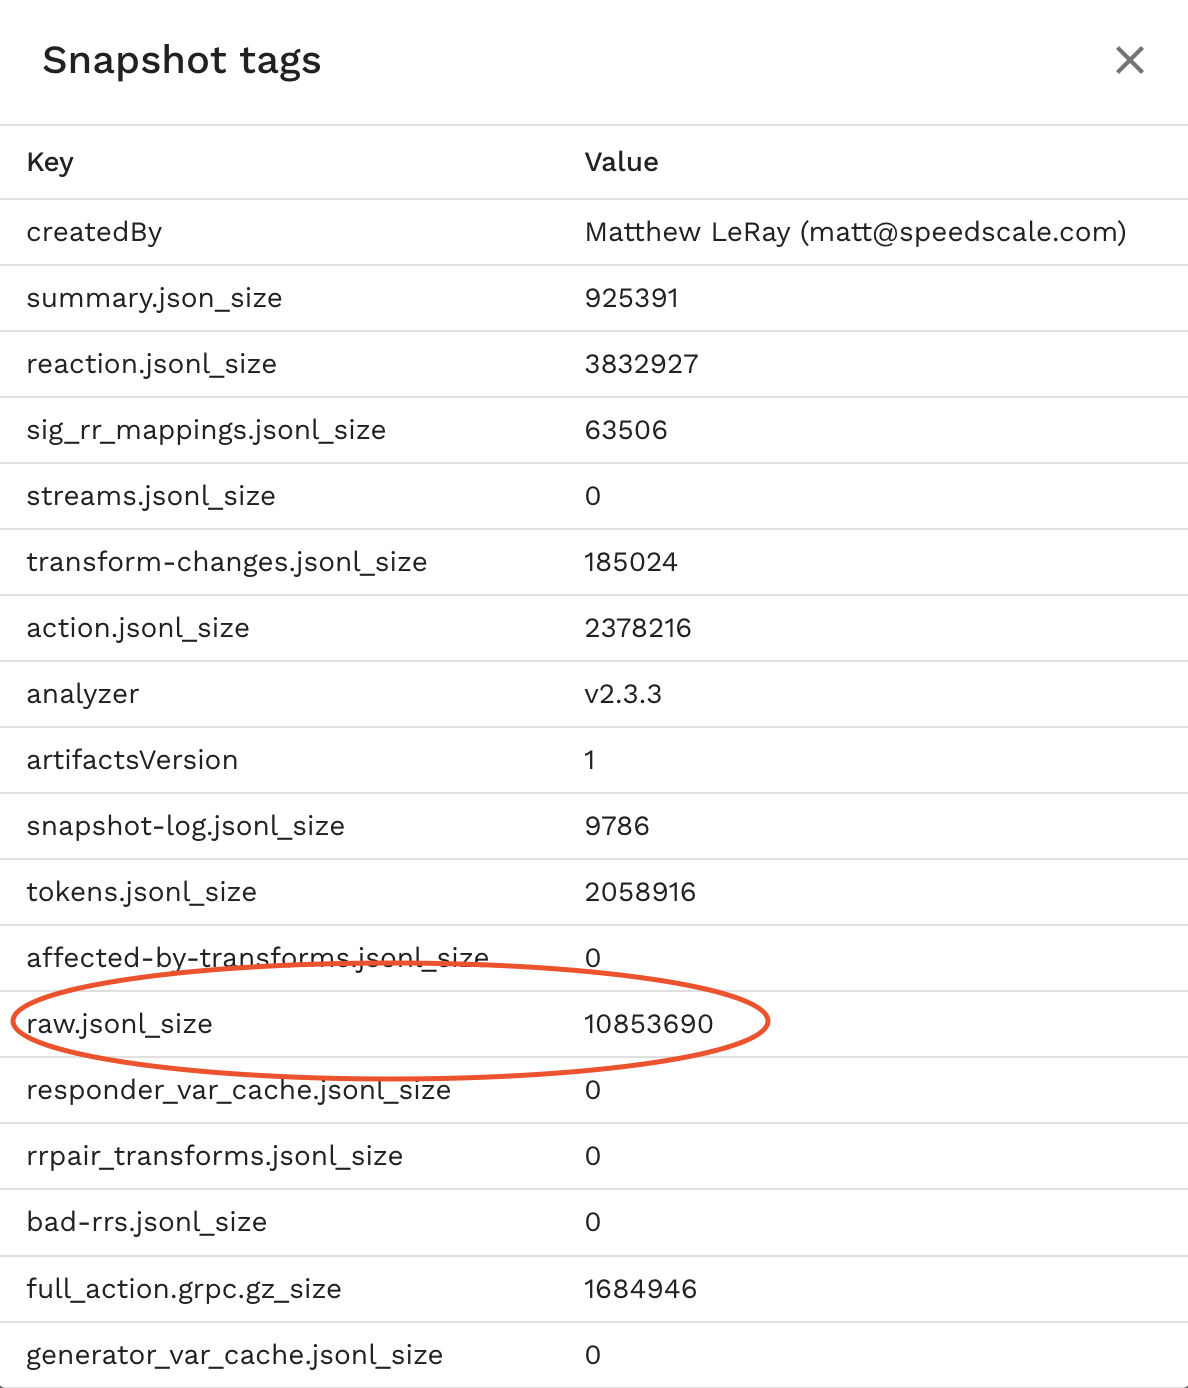
- Let's assume we want a 1 Gig snapshot since that is fairly easy to work with. We can do some basic multiplication to see that the existing file is roughly 10M and so if we captured 100x as much traffic that would be roughly 1GB. This assumes traffic size is fairly uniform which may or may not be reasonable for your application. Some apps have mid-day spikes so your mileage may vary.
- Run the same snapshot with 10x the timeframe (150 minutes or roughly 2.5 hours)
- Repeat step 2.
- If the snapshot is still too big then apply filters for repetitive or common issues as explained in this guide. Eliminating repetitive and useless heartbeats often times is all that is necessary.
- Repeat until snapshot runs in a reasonable time or fits in your infrastructure expectations.