Link queries to the request that ran them
When proxymock records a service, it captures the inbound requests and the SQL the service sends to Postgres or MySQL. To answer "which request ran this query?", it has to link the two.
Without help, proxymock links by time: a statement belongs to the request that was in flight when it ran. That is exact when requests arrive one at a time and a guess when they overlap, which is exactly when you most want to know.
If your application writes the request's trace context into a comment on each SQL statement, proxymock reads the comment and links the statement to that request exactly. Most frameworks can do this with a setting or an OpenTelemetry option, and this page shows how for each one.
What you see
Open any Postgres or MySQL pair in proxymock web. The Database section of its Info tab says which request caused it, marked by trace id when the comment named that request and by time when proxymock inferred it. The route and trace id read from the comment appear alongside it.
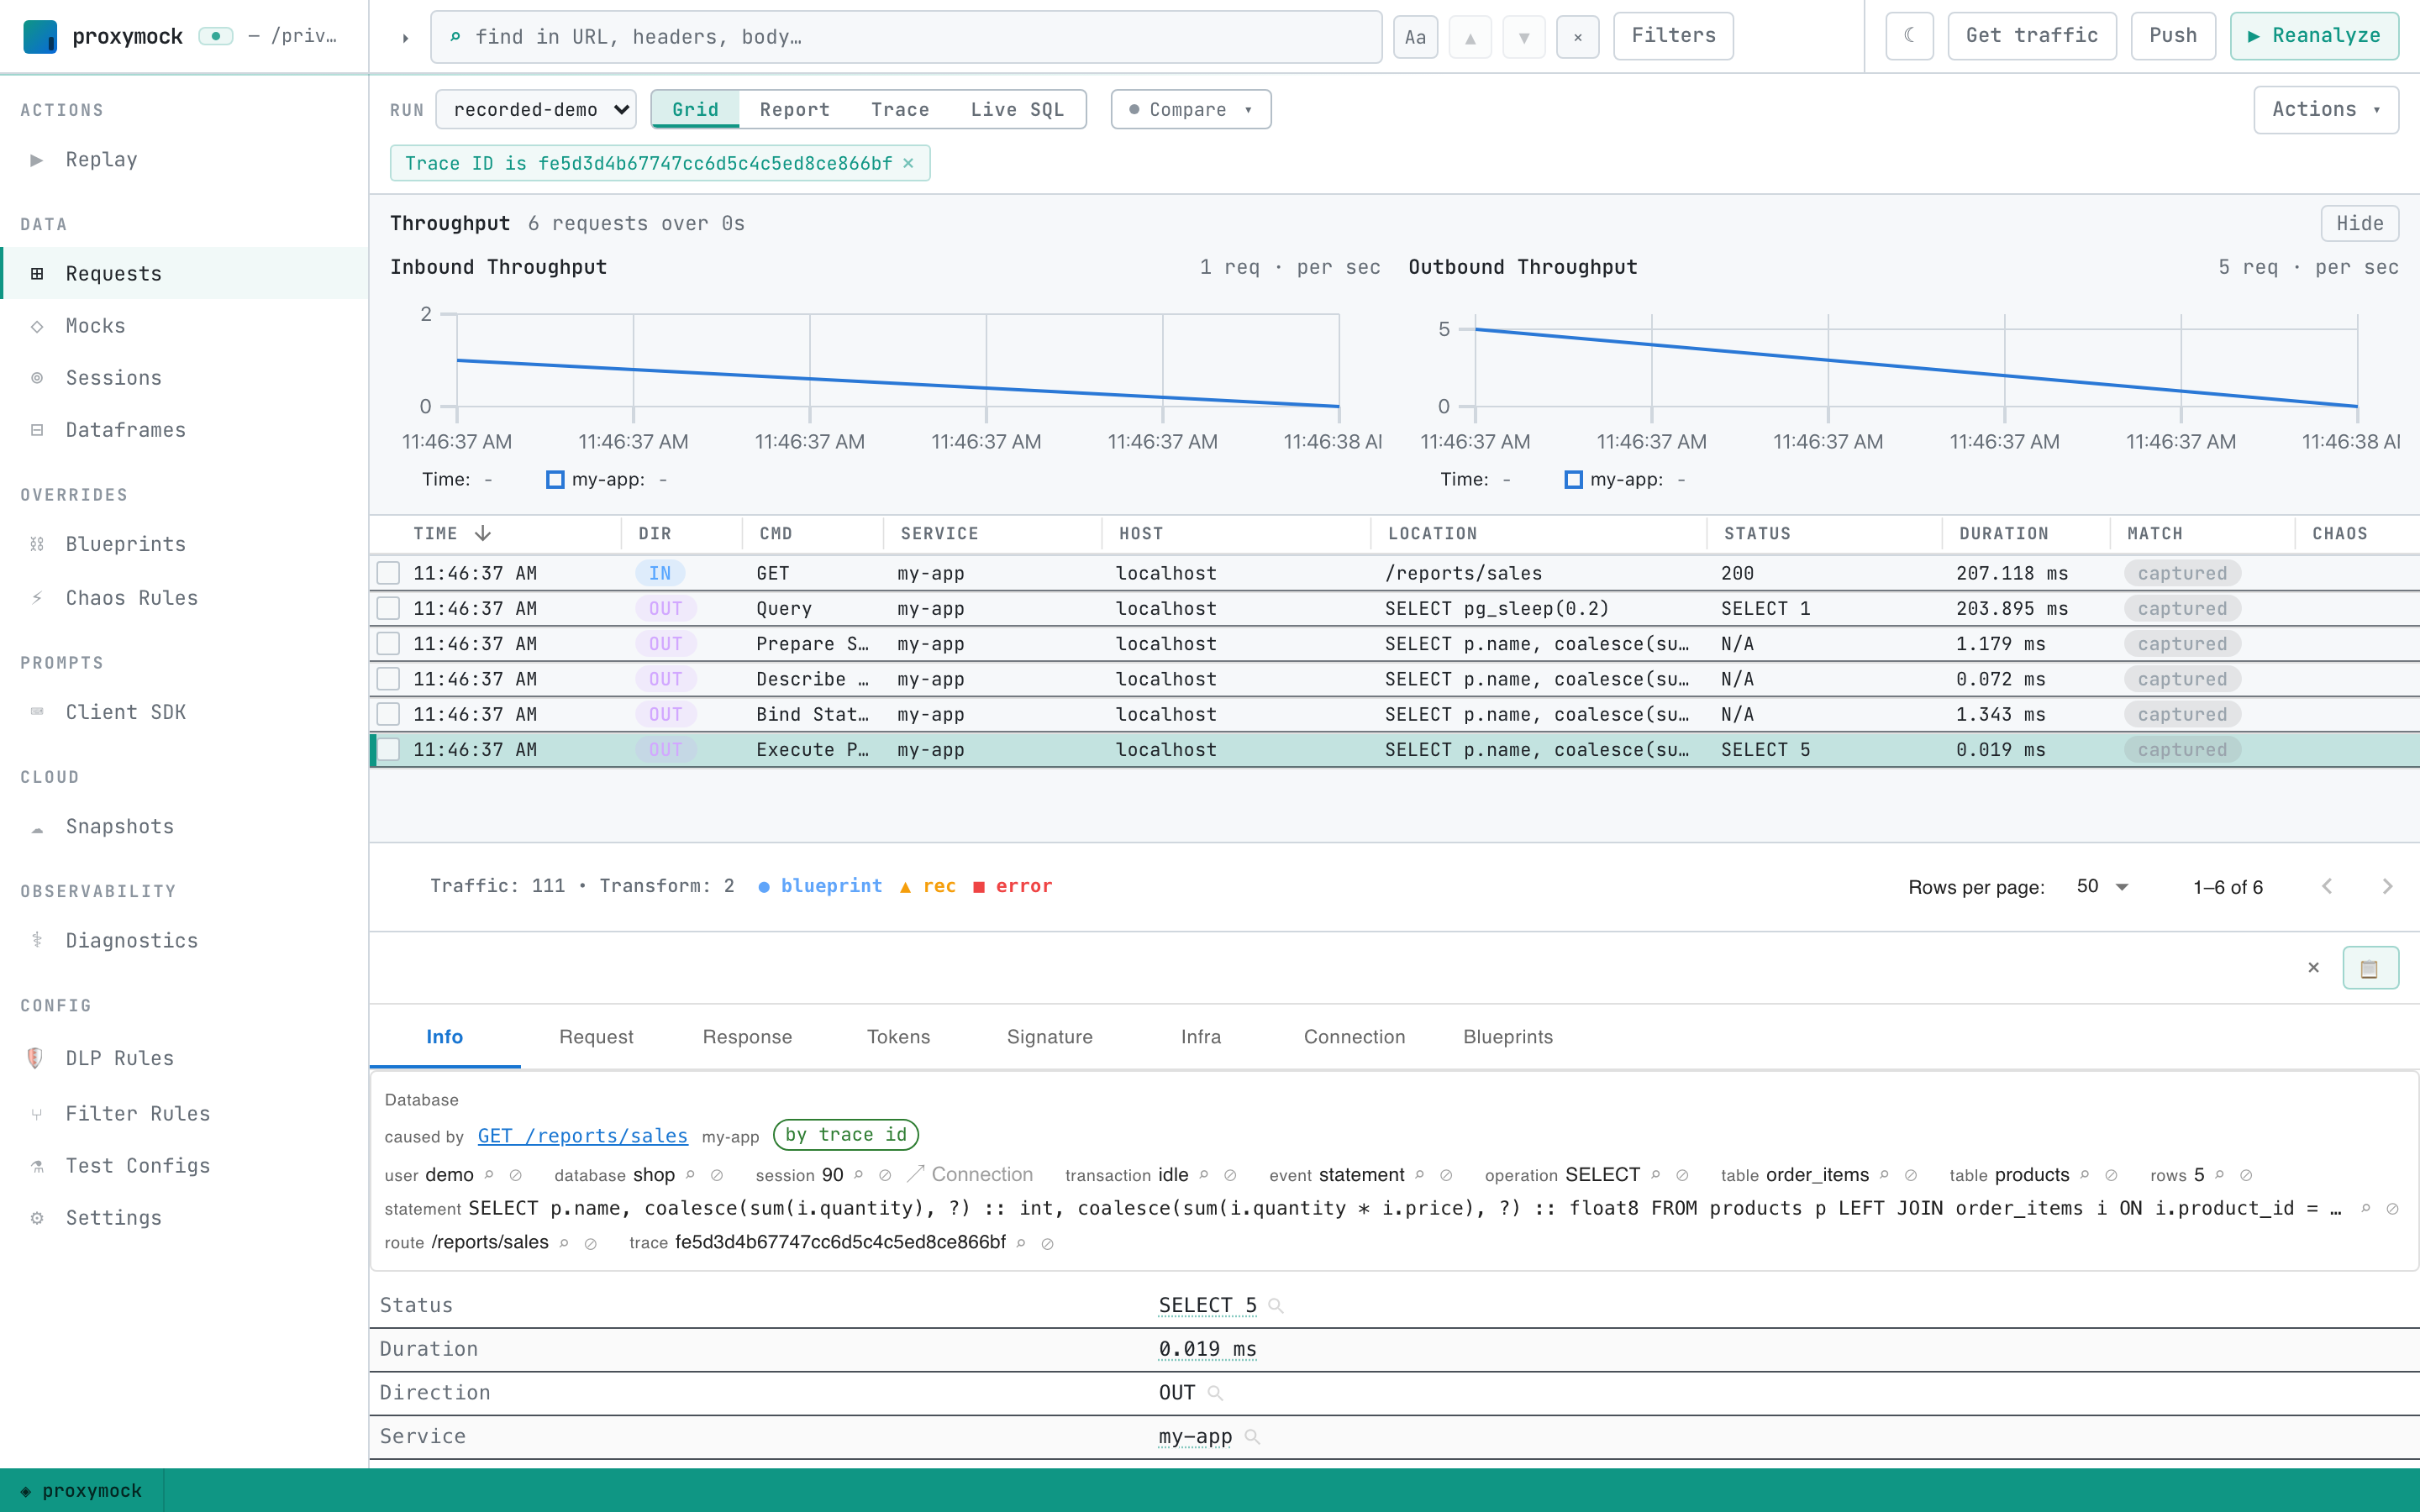
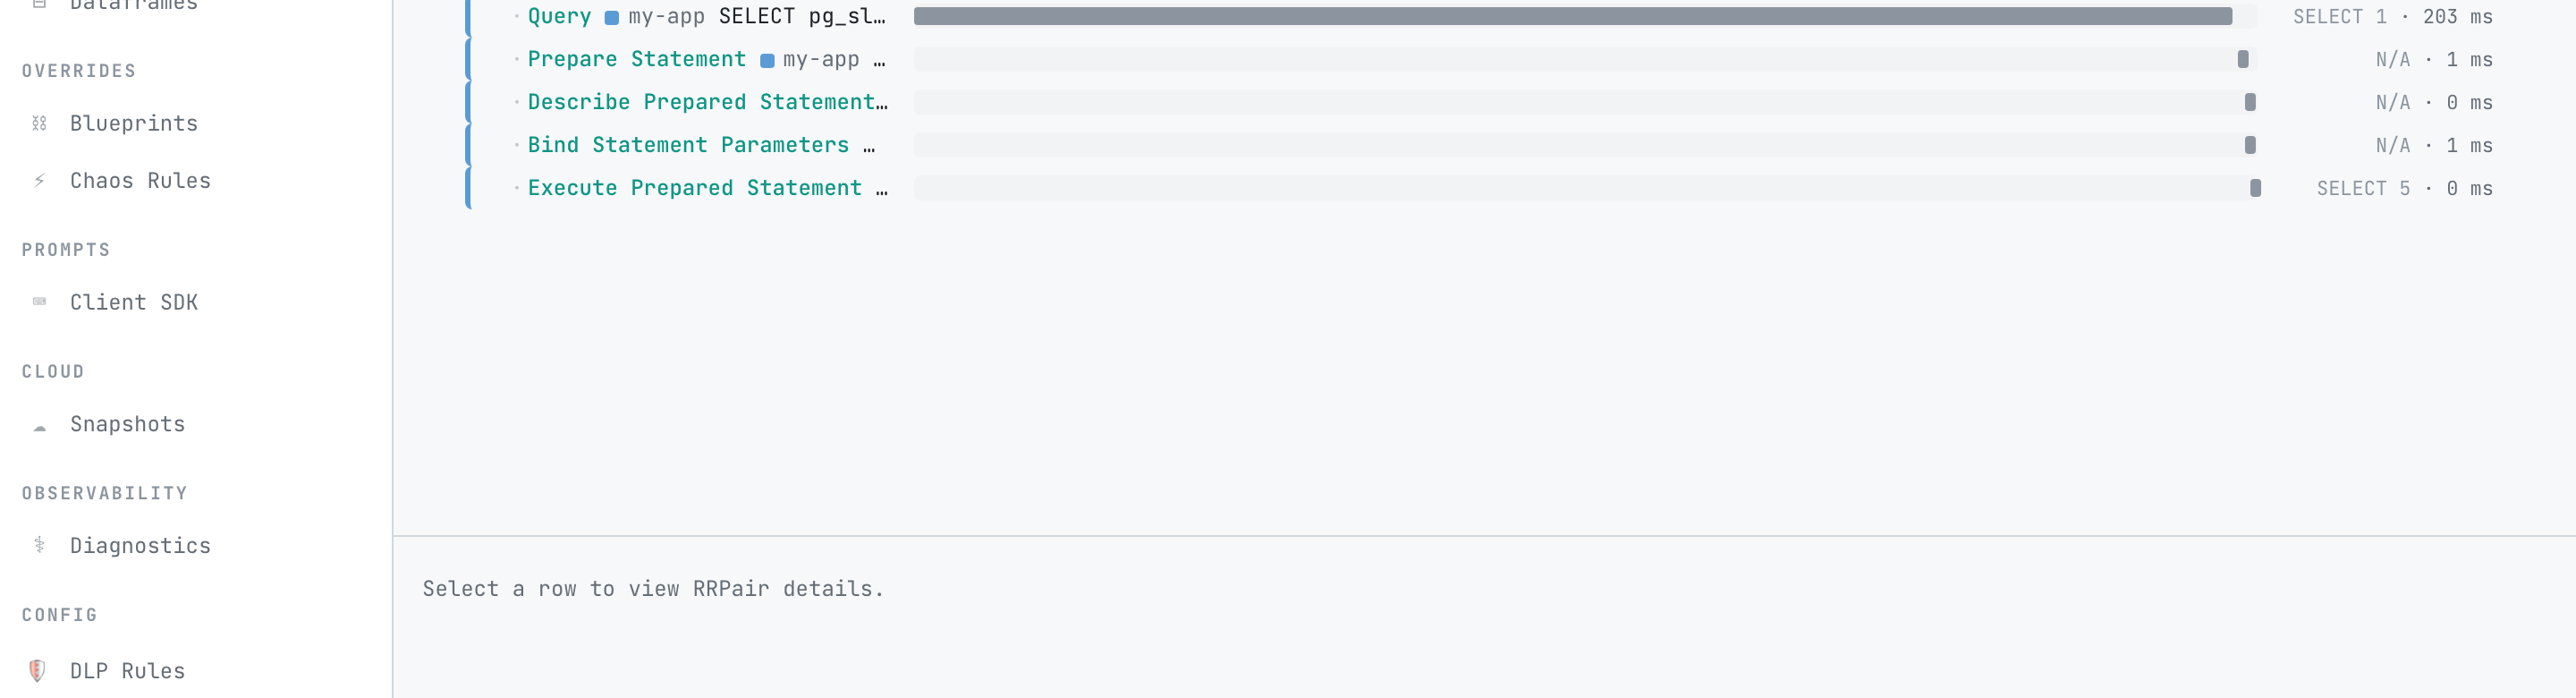
Add the Trace ID filter (Filters, then the Trace ID field) with a trace id to narrow the Requests list to that request and the queries it ran. Switch to the Trace lens to see them as a waterfall. Its header counts how many queries were linked by trace ID and how many by timing.
proxymock sql-report and the sql_report MCP tool count the statements each endpoint ran per request. Their summary says how many statements were linked by the trace id in their SQL comment:
Statements per inbound request (18 requests, 31 statements attributed, 20 of them by the trace id in their SQL comment, 1 outside any request):
In JSON output (-o json), requestLoad.exactStatements is that count, and ambiguousStatements counts the statements that were linked by time while several requests overlapped. A statement linked by its comment is never ambiguous.
How the link works
The comment uses the sqlcommenter format, or the key:value format of Rails query log tags and marginalia. proxymock reads the traceparent key, a W3C trace context value, and the route (route, or controller and action):
SELECT * FROM orders WHERE id = $1 /*controller='orders',action='show',traceparent='00-4bf92f3577b34da6a3ce929d0e0e4736-00f067aa0ba902b7-01'*/
It then finds the inbound request in the same service whose W3C traceparent (or B3) header carries the same trace id. The trace id is the join: the span id in the comment usually belongs to the database client span, which no recorded request carries.
Two rules keep the link honest:
- The request must contain the statement in time. A statement whose comment names a request that has already finished falls back to timing. The prepared statement caveat is where this happens.
- The inbound request has to carry the trace. When a service starts the trace itself, because nothing upstream sent a
traceparent, its inbound request has no trace id. proxymock then uses the service's outbound calls to other services, which carry the new trace, to find the request. When the service makes no such call, its statements link by time.
So the link is exact for a service behind a gateway, load balancer or caller that propagates trace context, and for a service that calls other services while it handles the request.
Try it with the lab
The sqlcommenter lab in mock-lab is a small Go service on Postgres that tags every statement. It ships a recording, so you can look at the links before running anything:
git clone https://github.com/speedscale/mock-lab && cd mock-lab/labs/sqlcommenter
make report
make web
make report runs proxymock sql-report on the committed recording and make web opens it in proxymock web. To record your own run, start Postgres with make up and run make capture. The load includes overlapping requests, an untagged query, a reused prepared statement, and requests without a traceparent, so the recording shows every kind of link.
Turn on SQL comments in your framework
Each setup below adds a traceparent to the comment. Most of them need OpenTelemetry tracing set up in the service, since the trace context comes from the current span.
Google's original sqlcommenter libraries were donated to OpenTelemetry, and the repository is now archived. Prefer the sqlcommenter option built into the OpenTelemetry instrumentation for your language where one exists.
Rails 7.1 and later
Rails query log tags write the comment. Use the sqlcommenter format and add a traceparent tag that reads the current trace from the OpenTelemetry Ruby SDK:
# config/application.rb
config.active_record.query_log_tags_enabled = true
config.active_record.query_log_tags_format = :sqlcommenter
config.active_record.query_log_tags = [
  :application, :controller, :action, :job,
  {
    traceparent: -> {
      carrier = {}
      OpenTelemetry.propagation.inject(carrier)
      carrier["traceparent"]
    }
  }
]
Leave config.active_record.cache_query_log_tags at its default of false, so the trace is read for every query. The Rails configuration guide notes that enabling query log tags disables prepared statements, which keeps each statement's comment current.
The OpenTelemetry pg and mysql2 instrumentations for Ruby can also write the comment themselves, with c.use 'OpenTelemetry::Instrumentation::PG', { propagator: 'tracecontext' } (and the same option for Mysql2).
Rails 6 and earlier (marginalia)
marginalia writes /*application:Shop,controller:orders,action:show*/ comments. It became part of Rails 7 as query log tags. Add a component for the trace:
# config/initializers/marginalia.rb
module Marginalia
  module Comment
    def self.traceparent
      carrier = {}
      OpenTelemetry.propagation.inject(carrier)
      carrier["traceparent"]
    end
  end
end

Marginalia::Comment.components = [:application, :controller, :action, :traceparent]
Django
The OpenTelemetry Django instrumentation adds sqlcommenter comments when you turn it on. The trace context is included by default:
from opentelemetry.instrumentation.django import DjangoInstrumentor

DjangoInstrumentor().instrument(is_sql_commentor_enabled=True)
The SQLCOMMENTER_WITH_* settings in settings.py choose the tags; SQLCOMMENTER_WITH_OPENTELEMETRY is the one that adds traceparent. Turn on the commenter in one place only: enabling it in a database driver instrumentation as well writes two comments.
The older google-cloud-sqlcommenter package does the same with its google.cloud.sqlcommenter.django.middleware.SqlCommenter middleware and SQLCOMMENTER_WITH_OPENTELEMETRY = True. It has not been released since 2021.
Flask and SQLAlchemy
The OpenTelemetry SQLAlchemy and psycopg2 instrumentations write the comment, traceparent included, when enable_commenter is on. The Flask instrumentation adds the route and controller to it:
from opentelemetry.instrumentation.flask import FlaskInstrumentor
from opentelemetry.instrumentation.sqlalchemy import SQLAlchemyInstrumentor

FlaskInstrumentor().instrument(enable_commenter=True)
SQLAlchemyInstrumentor().instrument(engine=engine, enable_commenter=True, commenter_options={})
commenter_options turns tags off; {"opentelemetry_values": False} would drop the traceparent, so leave it empty. Use Psycopg2Instrumentor().instrument(enable_commenter=True) instead when the app talks to psycopg2 directly.
Spring Boot and Hibernate
The OpenTelemetry Java agent adds the comment to every JDBC statement, which covers Hibernate, Spring Data and plain JDBC. It is experimental and needs agent 2.21.0 or later:
java -javaagent:opentelemetry-javaagent.jar \
  -Dotel.instrumentation.jdbc.experimental.sqlcommenter.enabled=true \
  -jar app.jar
The environment variable OTEL_INSTRUMENTATION_JDBC_EXPERIMENTAL_SQLCOMMENTER_ENABLED=true does the same. Hibernate's own hibernate.use_sql_comments setting describes the query and carries no trace context.
Node.js
The OpenTelemetry pg instrumentation adds the comment to every query sent through pg, which includes queries from knex and Sequelize on Postgres:
const { PgInstrumentation } = require('@opentelemetry/instrumentation-pg');

new PgInstrumentation({ addSqlCommenterCommentToQueries: true });
The mysql2 instrumentation has the same addSqlCommenterCommentToQueries option. Both skip a query that already contains -- or /*, and the pg instrumentation skips named (prepared) queries, which would otherwise keep a stale trace.
The archived @google-cloud/sqlcommenter-knex and @google-cloud/sqlcommenter-sequelize packages wrap knex or Sequelize as Express middleware. Pass {traceparent: true} in their include options, since the trace is off by default.
Go
For database/sql, otelsql adds the comment when you open the database with WithSQLCommenter. The option is experimental:
db, err := otelsql.Open("pgx", dsn, otelsql.WithSQLCommenter(true))
The archived github.com/google/sqlcommenter/go/database/sql wrapper does the same with core.CommenterConfig{EnableTraceparent: true, EnableRoute: true}.
There is no official option for pgx used directly. Append the comment yourself, as the sqlcommenter lab does in about a hundred lines: read the trace from the request context, URL-encode each value, and add /*route='...',traceparent='...'*/ to the statement.
Datadog Database Monitoring
Datadog tracers write the comment when Database Monitoring and APM are connected in full mode, the only mode that includes traceparent:
DD_DBM_PROPAGATION_MODE=full
The comment also carries Datadog's own keys, such as dddbs and ddps, which proxymock ignores. Datadog lists the tracer versions and database libraries that support full mode for Postgres and MySQL.
The inbound request needs to carry the same trace in a W3C traceparent header, so make sure tracecontext is one of the tracer's propagation styles (DD_TRACE_PROPAGATION_STYLE) in the services that call this one.
Datadog downgrades some prepared statements to service mode, which drops the traceparent. The Java tracer before 1.44 does this for every prepared statement; see Datadog's page for the current rules.
Prepared statements
A prepared statement keeps the SQL text it was prepared with, comment included. When a driver or ORM prepares a statement once and reuses it across requests, every reuse carries the trace of the request that prepared it.
proxymock guards against this: a statement links by trace id only when the request with that trace id also contains it in time. A reuse by a later request names a request that has already finished, so it falls back to timing instead of linking to the wrong request.
To keep links exact, let the comment change with each request:
- Rails disables prepared statements when query log tags are on.
- The OpenTelemetry pg instrumentation for Node skips named (prepared) queries rather than write a stale trace, and Datadog's tracers downgrade some prepared statements to
servicemode. - A statement cache keyed on the full SQL text, such as pgx's default cache in Go, prepares a new statement for each new comment, so the link stays exact.
A unique comment on every query also means the database cannot reuse a cached plan for it. The OpenTelemetry semantic conventions call this out, and some databases are more sensitive to it than others, so check with whoever runs your database before you turn tagging on in production.
Untagged traffic still links
Tagging is optional. Statements without a comment, or with a comment that has no traceparent, link to the request that was in flight when they ran, as they did before. A recording can mix both: the health check your tracing ignores links by time, and the tagged queries link exactly.