Topology and cluster visibility
The Topology and Nodes tabs in proxymock web give you a live,
read-only view into a connected Kubernetes cluster. Two in-cluster
Speedscale components back them:
- The forwarder supplies the live topology graph and node/pod metrics — the moving parts of the Topology and Nodes tabs.
- The inspector supplies Kubernetes troubleshooting detail: a workload's describe-style status and health, its events, pod logs, its config dependencies, and a browsable view of the namespace's ConfigMaps, Secrets, and Services.
This page is in two halves. Connecting to the
cluster covers how proxymock web
reaches the forwarder (and how to fix it when it can't).
Workload and resource visibility
covers everything the inspector adds once you're connected.
Connecting to the cluster
The forwarder is the same in both viewing paths below — only the
transport between it and your screen differs. proxymock web does the
local plumbing for you: by default, it auto-port-forwards to
speedscale-forwarder in the speedscale namespace using your current
kube-context. When that works, you don't need to do anything. When it
doesn't, the in-app chooser lets you fall back to Speedscale Cloud, or
surfaces what to fix.
Path 1 — Auto port-forward (default)
[Forwarder pod] ◀── kubectl port-forward (auto) ──▶ [proxymock web] ──▶ [Your browser]
On startup, proxymock web opens a stable local listener, port-forwards
through your kubeconfig to the speedscale-forwarder pod's gRPC port
(8888), and tells the embedded server to dial that listener. The
supervisor reconnects with exponential backoff if the SPDY connection
dies (pod restart, apiserver blip, transient network failure).
Best when: you have authenticated kubectl access to the cluster.
Pick a different kube-context
proxymock web --kube-context=my-other-context
Defaults to the current context if omitted. Ignored when
--forwarder-addr is set explicitly (see below).
Skip the auto port-forward
Pass an explicit address:
proxymock web --forwarder-addr=localhost:8888
This is what you want when something else is already exposing the
forwarder (a tunnel, an SSH port-forward, a previously running
kubectl port-forward, a forwarder reachable directly on a flat
network, etc.). When --forwarder-addr is set, auto port-forward and
--kube-context are both ignored.
Disable the Observability surface entirely
proxymock web --forwarder-addr=""
Explicit empty value opts out. Use this on a machine without cluster access where you only want the local replay/mock workflows.
Path 2 — Speedscale Cloud
[Forwarder pod] ──egress──▶ [Speedscale Cloud] ──▶ [Your browser]
The forwarder ships telemetry to Speedscale Cloud, and you view it at app.speedscale.com. No connection between your laptop and the cluster is needed — just cluster egress to Speedscale Cloud.
Best when: you don't have direct cluster credentials on the machine you're viewing from.
In the in-app chooser, Open Dashboard takes you straight there.
Troubleshooting the connection
The chooser appears whenever the local view can't reach the forwarder. It distinguishes two states:
-
"Topology is offline" — the auto port-forward is in place but the upstream gRPC dial is failing. The supervisor is reconnecting in the background; Retry connection re-pings immediately. Common causes: the forwarder pod is restarting, the apiserver dropped the SPDY connection, the cluster lost connectivity. Usually self-heals.
-
"Topology isn't connected" — auto port-forward failed at startup, or you opted out with
--forwarder-addr="". The fix is a process restart, so the card is muted and there is no Retry button. Check theproxymock webstderr for the exact failure — typical messages include "load kubeconfig", "no such context", or "no pods matched app=speedscale-forwarder".
Diagnostic command
Both states show:
kubectl get svc speedscale-forwarder -n speedscale
If this succeeds, you have credentials to the cluster and the forwarder
service exists. If it fails, fix the access problem first — restart
proxymock web afterward if you're in the "not connected" state.
Switching paths
Both paths can coexist. If your machine loses cluster credentials, fall back to Speedscale Cloud; if Cloud is unreachable from your network, fall back to the local auto port-forward. The chooser appears whenever the local view can't reach the forwarder, so you can always switch.
Workload and resource visibility
Once you're connected, clicking a workload in the Topology graph opens a detail drawer, and a third Observability tab — Resources — lets you browse the namespace's ConfigMaps, Secrets, and Services. All of this data comes from the inspector, not the forwarder, and is read-only.
How it works
The inspector is a Speedscale in-cluster component that already holds
read access to your cluster under the operator's ServiceAccount.
proxymock web opens a second background port-forward — to the
speedscale-inspector pod alongside the forwarder one — and the detail
and resource views make REST calls over that tunnel. There is nothing to
configure on the proxymock web side; the tabs appear automatically when
the inspector is reachable.
[Inspector pod] ◀── kubectl port-forward (auto) ──▶ [proxymock web] ──▶ [Your browser]
A few things follow from this design:
- Reads run under the inspector's ServiceAccount, which has read access to pods, pod logs, events, Deployments/ReplicaSets/StatefulSets, Services, ConfigMaps, and Secrets. Nothing runs under your local kubeconfig — so what you can see is governed by the inspector's RBAC, not your personal cluster permissions.
- The inspector is deployed by default whenever the Speedscale operator manages a connected cluster, and its REST endpoint is on by default. Both are configurable — see Configuration and access control.
- Missing tabs mean a graceful fallback, not an error. If the inspector isn't deployed (an older operator), its REST endpoint is disabled, or the port-forward can't be established, the detail drawer and Resources tab simply don't appear. The Topology graph and Nodes metrics (served by the forwarder) keep working regardless.
- The port-forward is the trust boundary. The inspector's REST
endpoint is cluster-internal (a
ClusterIPService, never exposed externally). Anyone who canport-forwardto the inspector gets its ServiceAccount-level read access — the same model as the forwarder port-forward. Secret values are never exposed regardless (see Secrets).
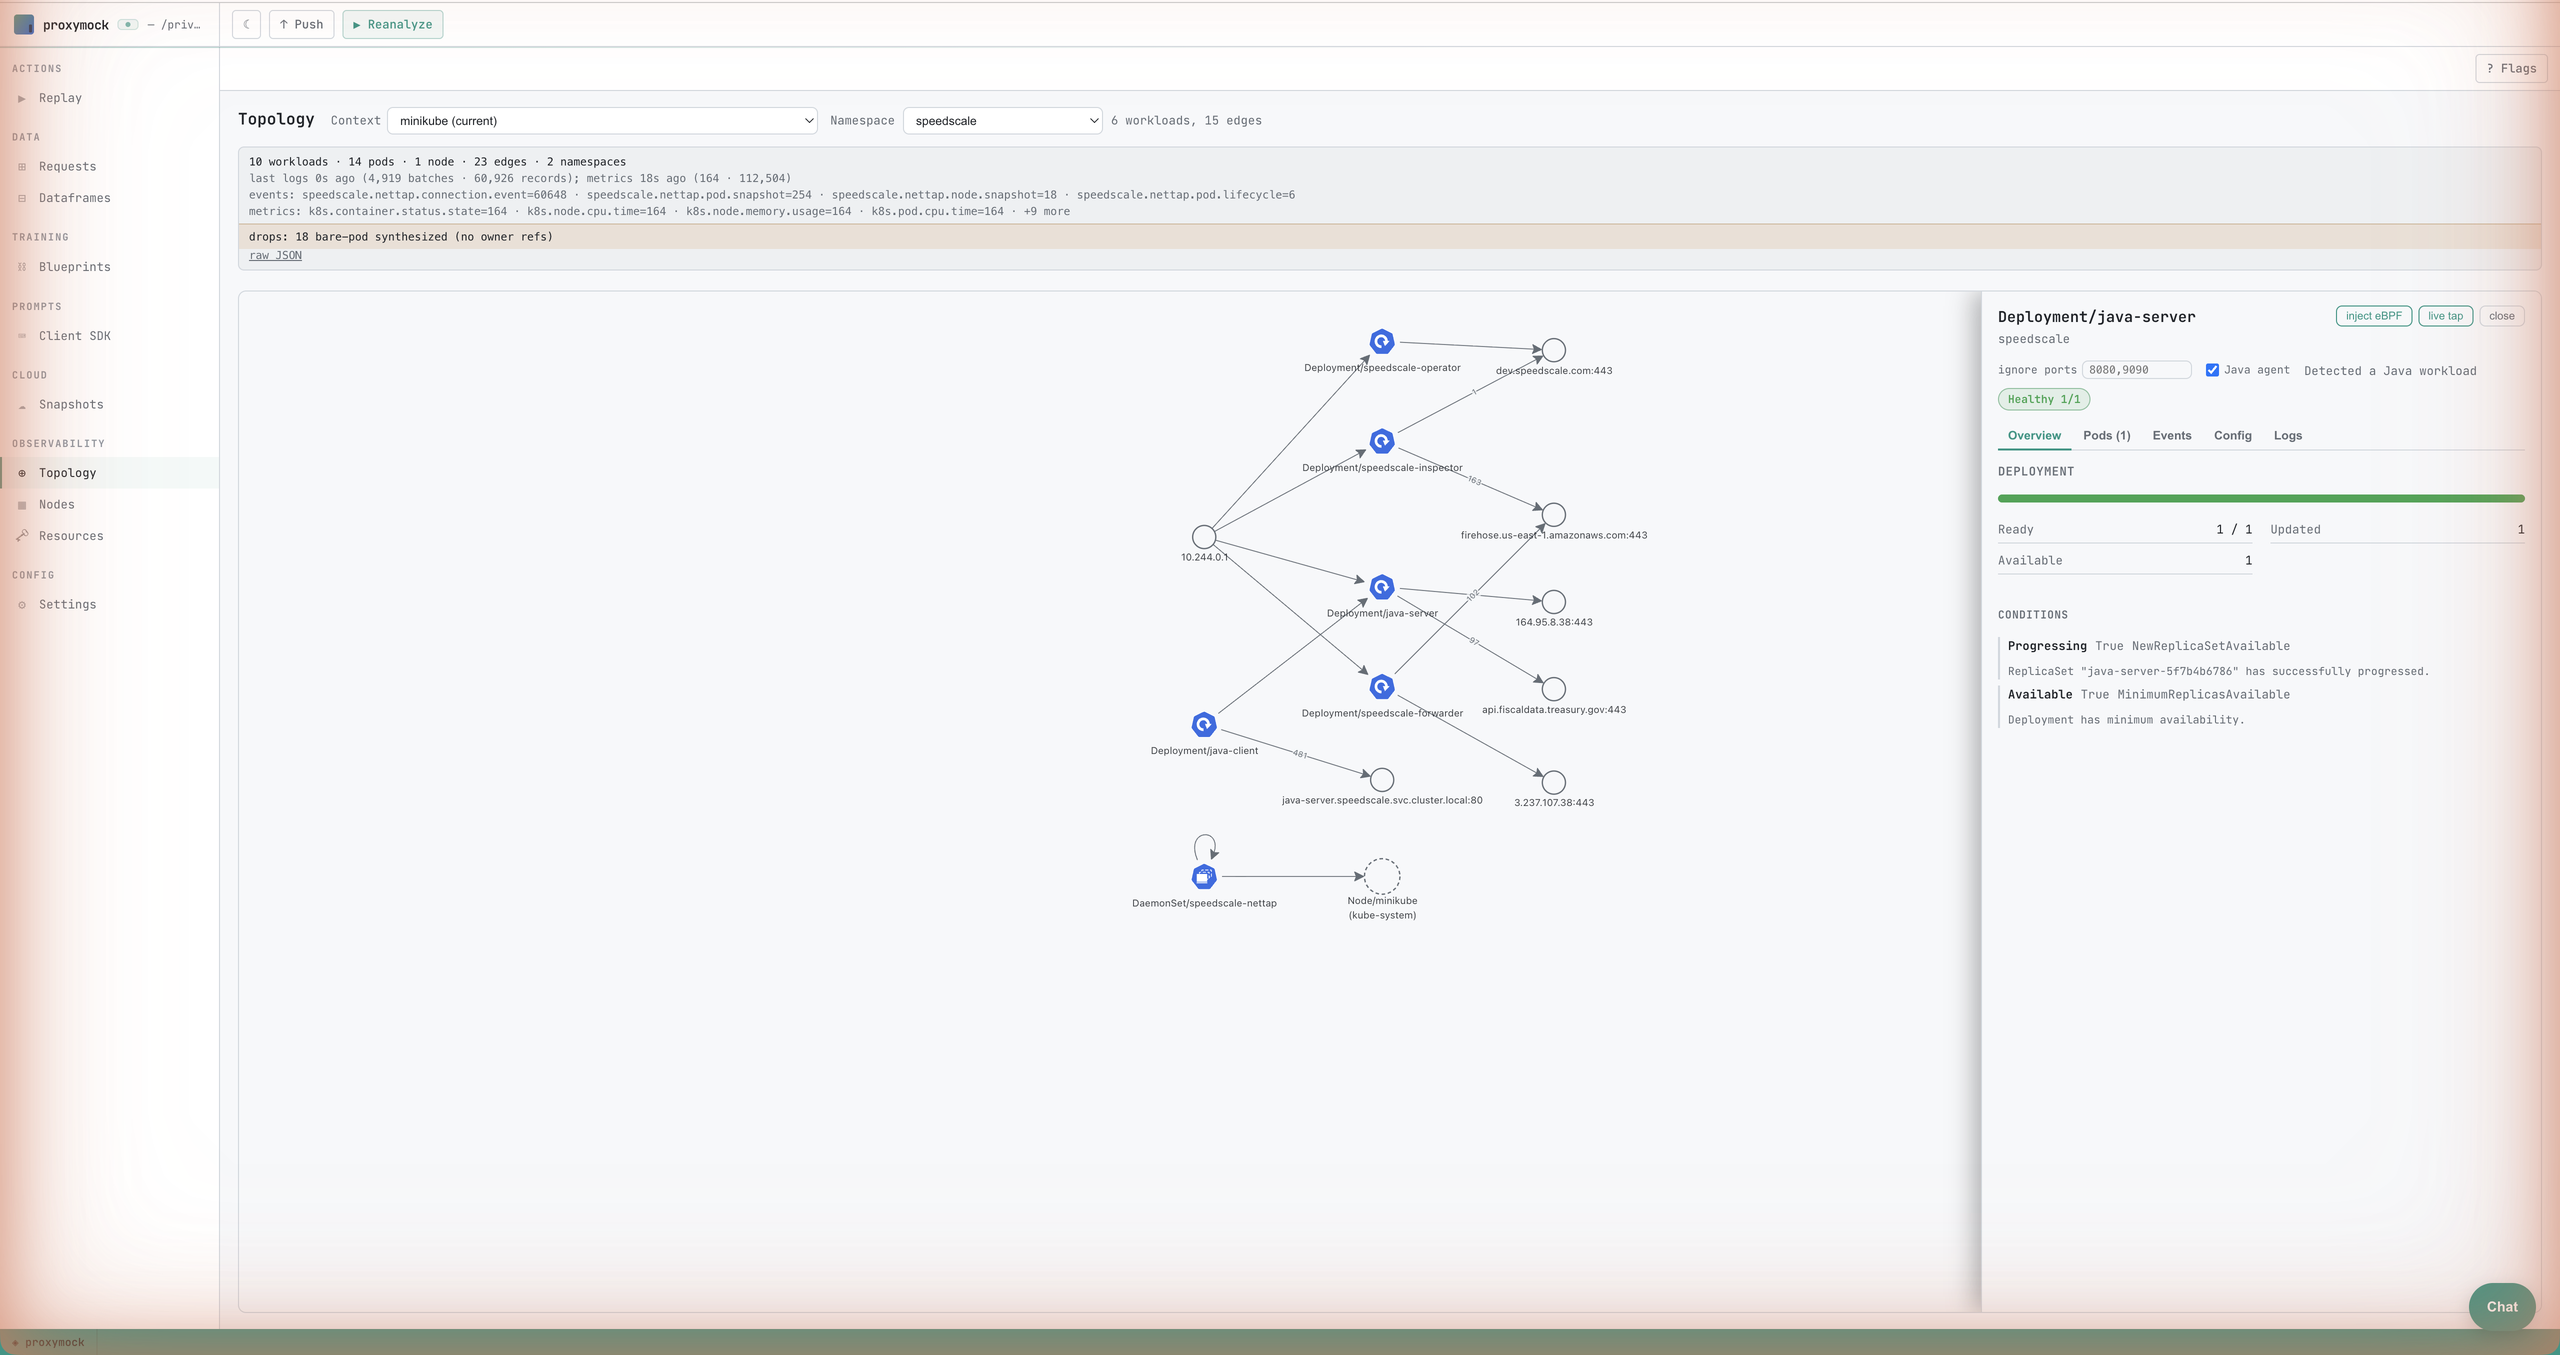
Workload type icons
Workloads on the graph carry the official Kubernetes icon for their kind — Deployment, StatefulSet, DaemonSet, ReplicaSet, Job, and CronJob — so you can tell a stateful set from a daemon set at a glance without reading labels.
The workload drawer
Click any workload node to open its drawer. It has five tabs, and each one poll-refreshes while it's open, so the view tracks the live cluster without a manual reload.
- Overview — the describe-style summary: rollout status (desired /
ready / updated / available replicas), the workload's conditions, and
health badges that call out trouble such as
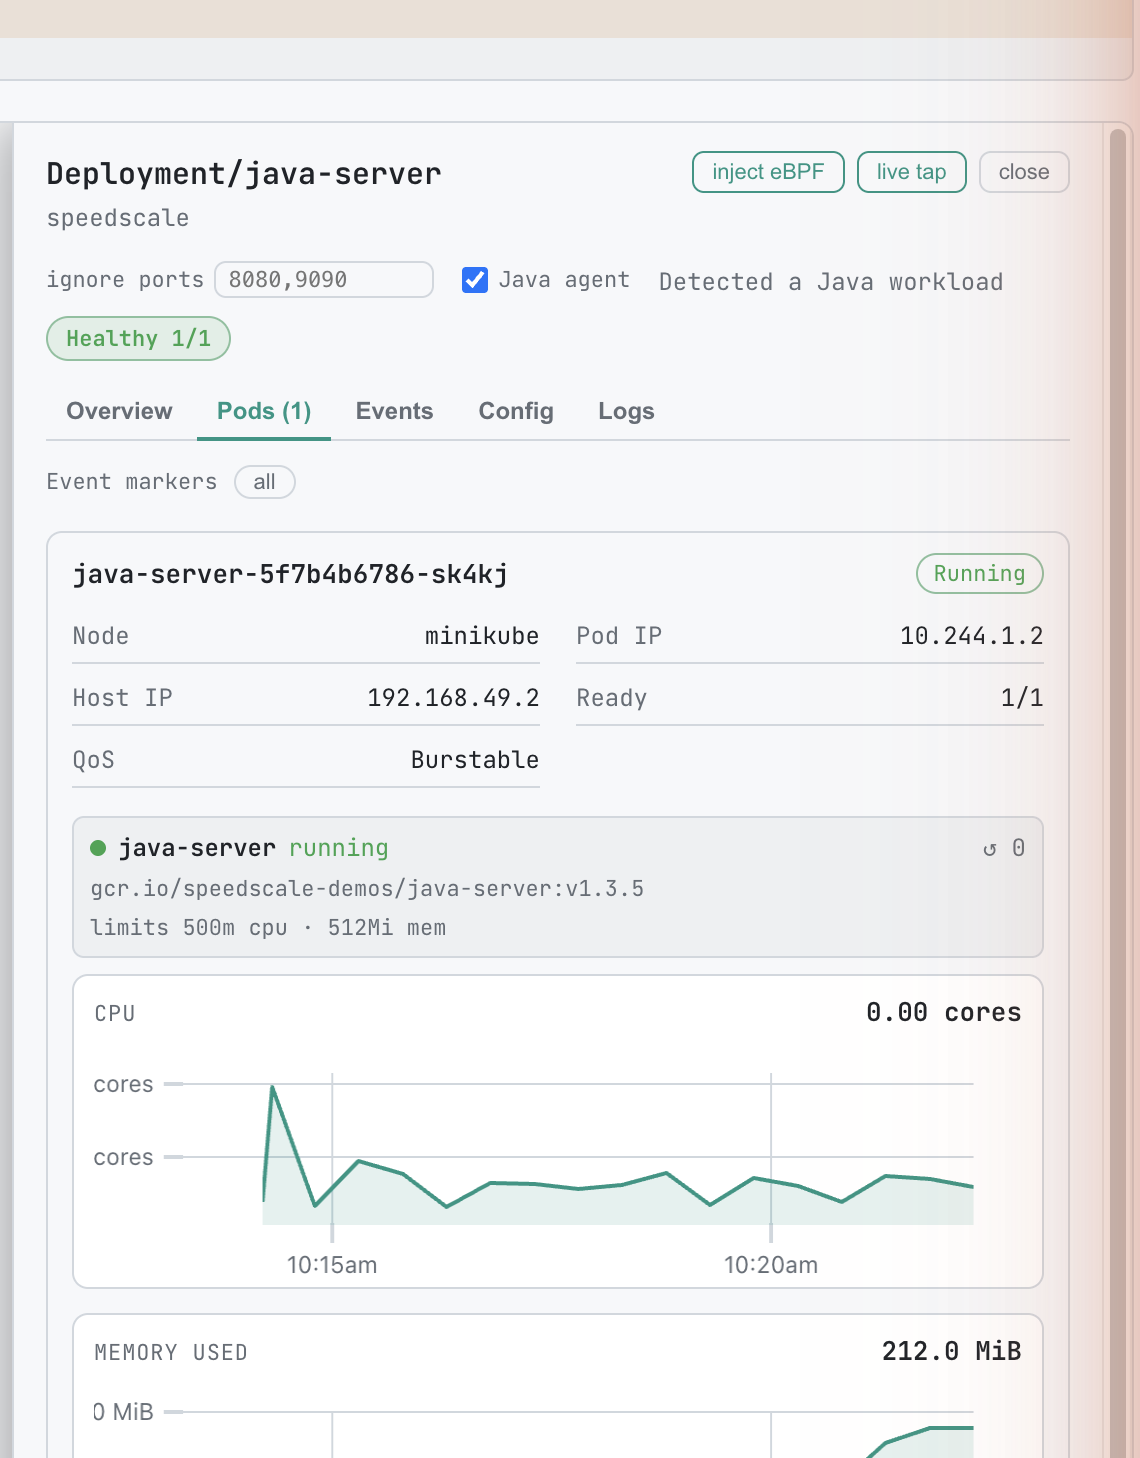
CrashLoopBackOff,ImagePullBackOff, andOOMKilled. - Pods — the workload's pods straight from the Kubernetes API: each pod's phase, readiness, restart count, and per-container state. Because this list is sourced from the inspector (not from telemetry), a pod that's restarting or churning doesn't disappear from the list.
- Events — the workload's Kubernetes events (and those of its
ReplicaSets), newest first, with warnings highlighted. This is where a
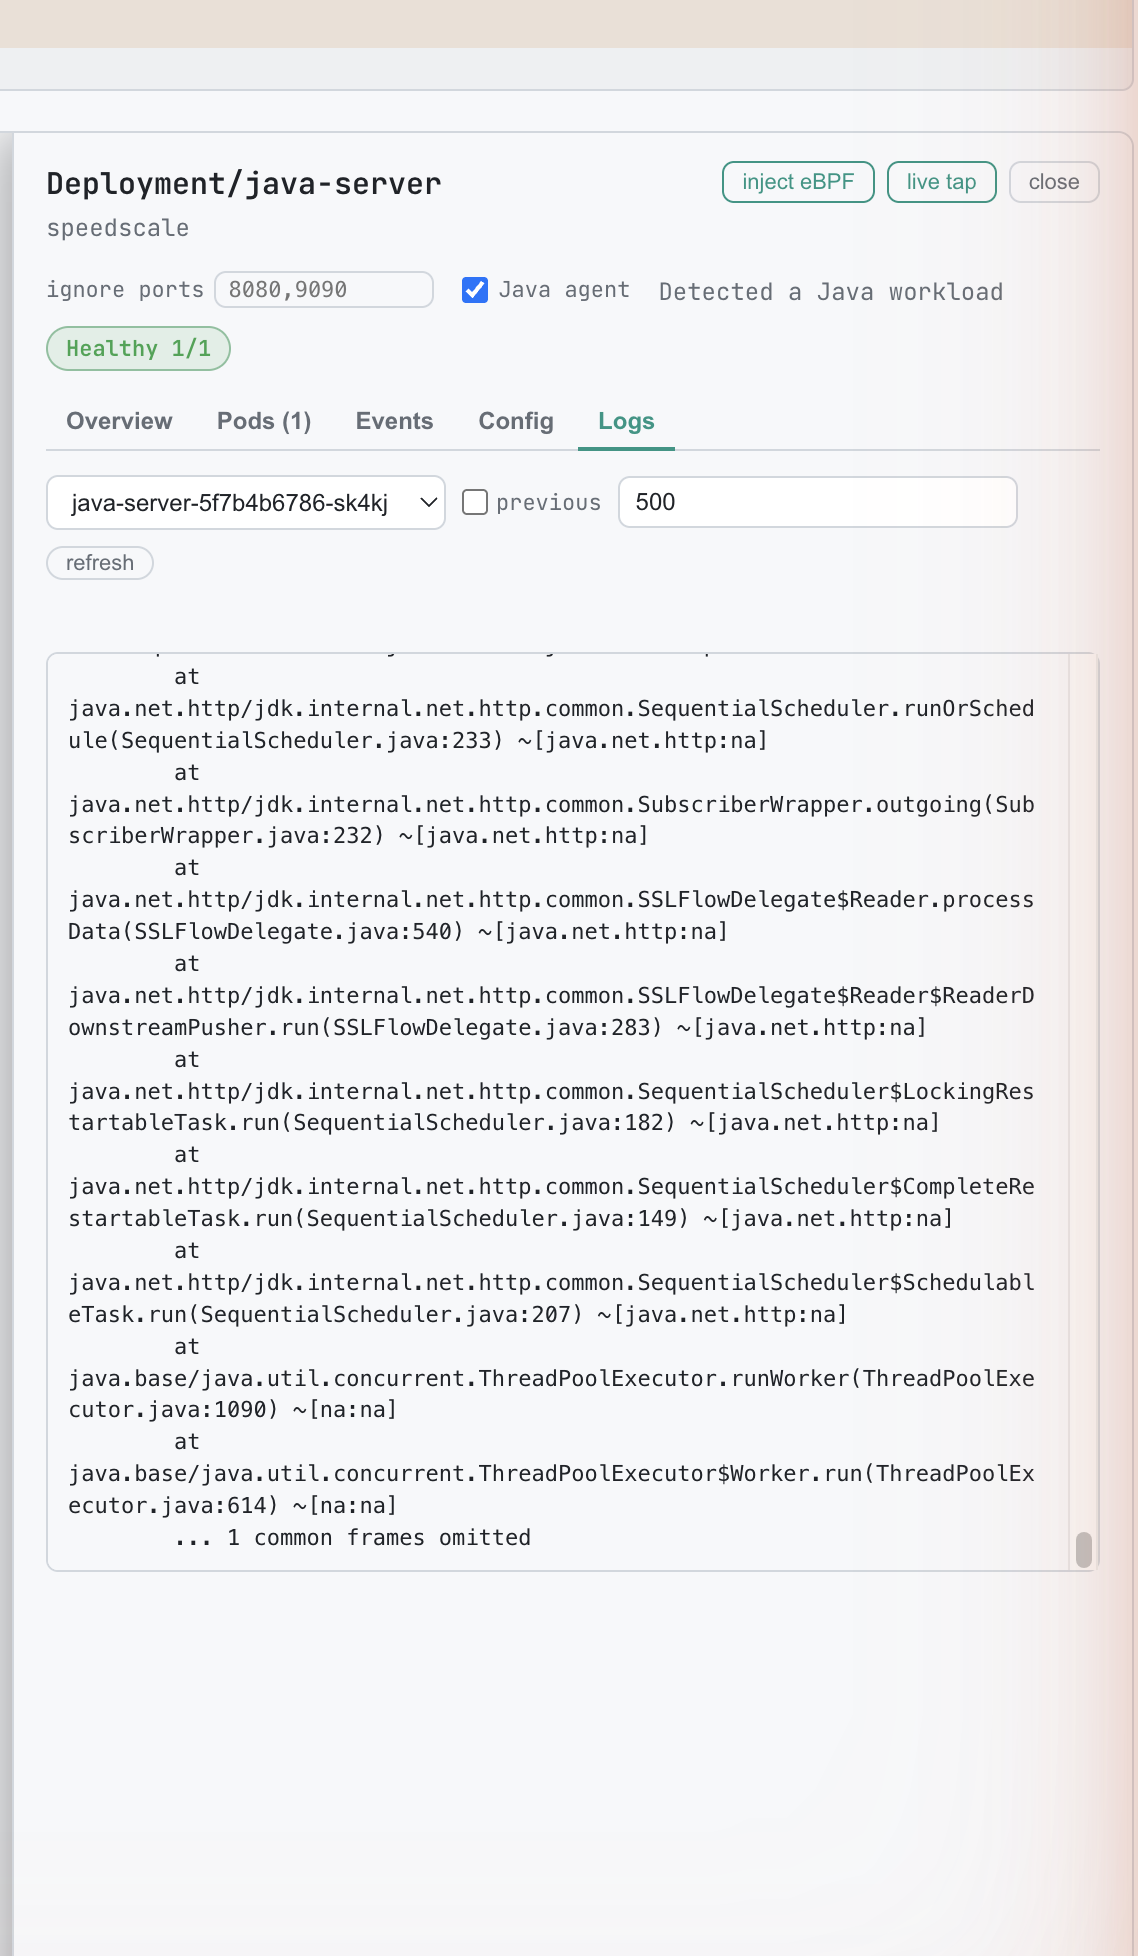
FailedScheduling,FailedCreate, or image-pull error shows up. - Logs — a bounded tail of a pod's logs. Choose the container, and toggle Previous to read the last terminated container's logs after a crash. The view poll-refreshes in place. This is a bounded tail, not a full-history dump and not a streaming live tail.
- Config — the workload's dependencies: the ConfigMaps, Secrets,
PersistentVolumeClaims, and Services it references, plus its
ServiceAccount. Each reference is annotated with how it's reached
(an environment variable, an
envFrom, a volume mount, an image-pull secret, or a Service selector) and whether it's optional.
Event markers on metric charts
The pod metric charts in the drawer mark the times of Kubernetes events with dashed vertical lines, so you can line a CPU spike or a restart up against the event that caused it. Hover a marker for the event detail, and use the toggle to switch between all events and warnings only.
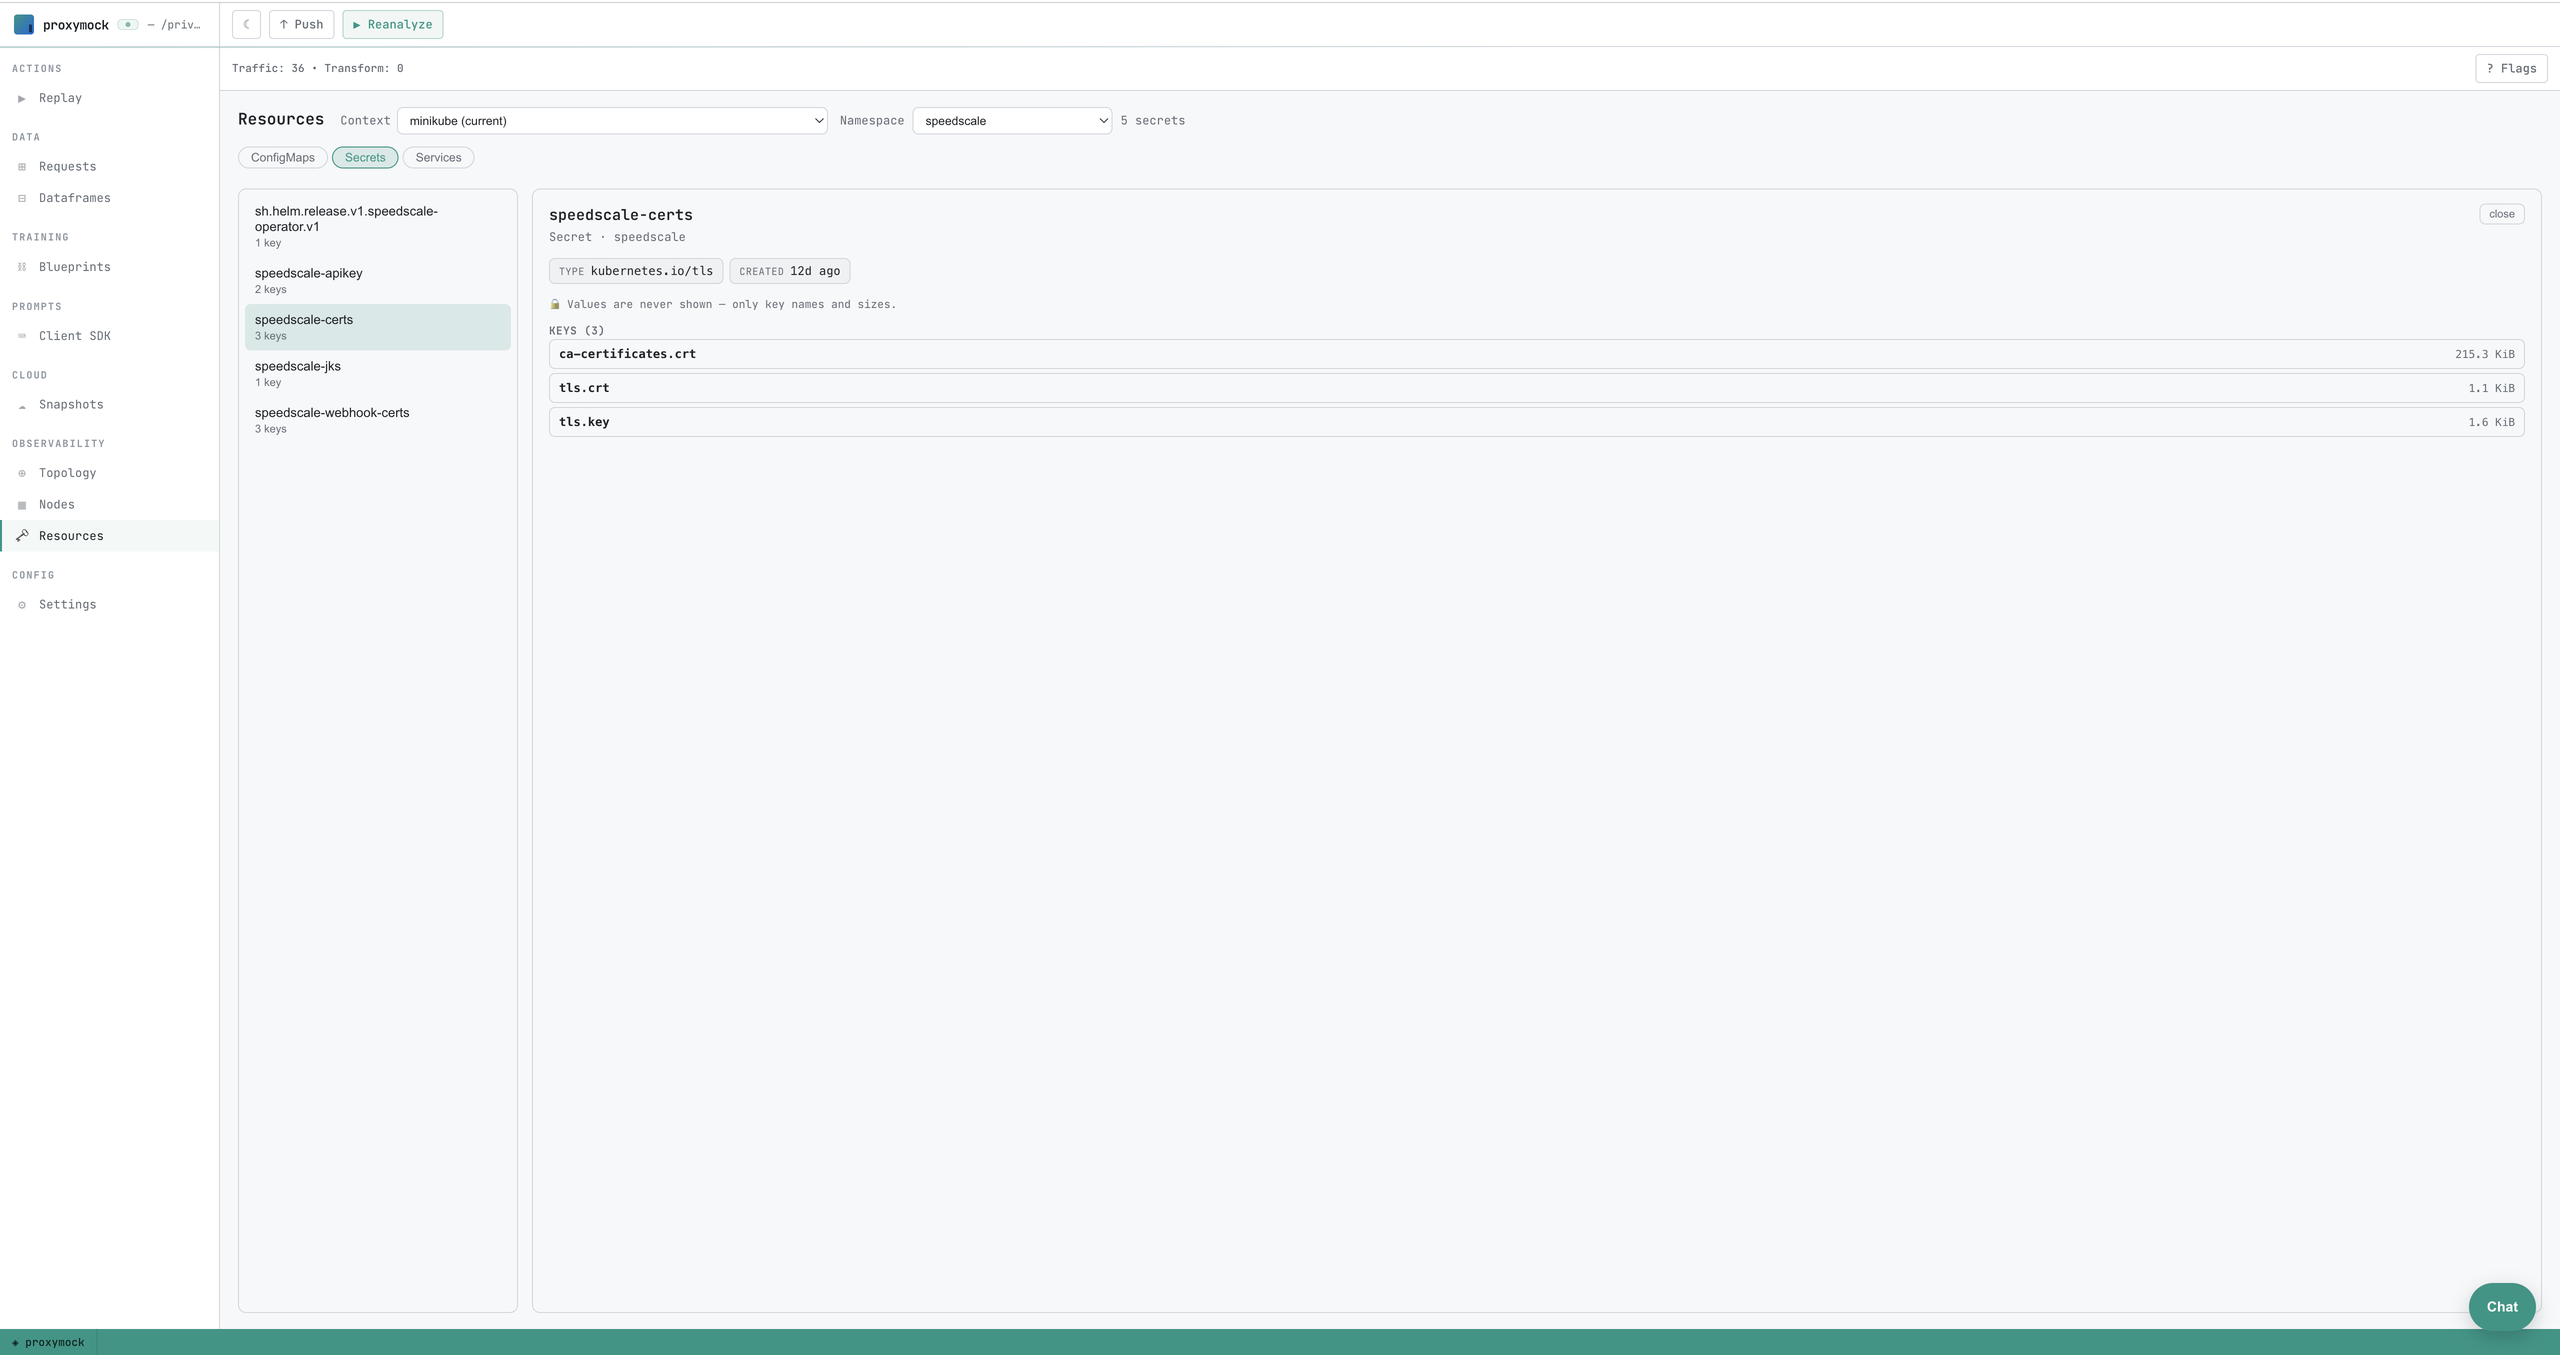
Browsing cluster resources
The Resources tab is the third entry under Observability. Pick a namespace, then switch between ConfigMaps, Secrets, and Services — the list is on the left, the selected item's detail on the right.
ConfigMaps
ConfigMaps are non-secret by Kubernetes' own definition, so both keys and values are shown in the clear. Binary entries are listed by key name only (their bytes are omitted as non-text).
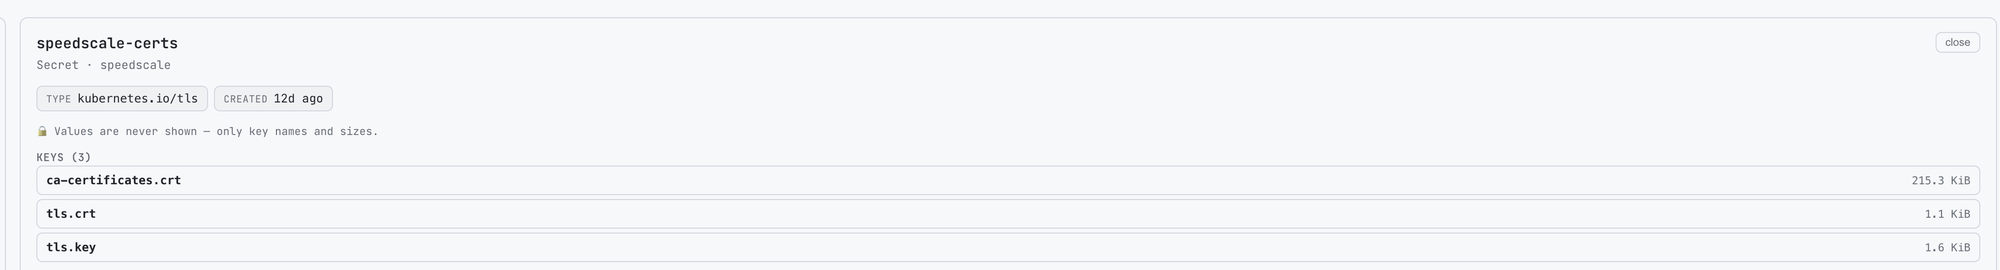
Secrets
Secrets are shown as a key inventory only — never values. For each Secret you see its type and, for every key, the key name and the size of its value in bytes; the value itself is never read or transmitted by the inspector. A lock note in the UI reinforces this.
Which Secrets you can see is governed by the operator's secret
allowlist (SECRET_ACCESS_LIST):
- Empty (the default) — every Secret in the namespace is listable, as keys-only summaries.
- Set to a list of names — Secret listing is turned off entirely.
The Secrets list shows a "restricted by the operator's secret allowlist"
notice instead of enumerating Secrets, and only the explicitly named
Secrets remain individually accessible (still keys-only). This is
enforced at the RBAC layer too: with an allowlist set, the inspector's
ServiceAccount is granted
geton those named Secrets but notlist, so it cannot enumerate the rest even if asked.
Services
Each Service shows its type, cluster IP, any external addressing, its pod selector (which relates it back to the workloads it routes to), and its port mappings.
Configuration and access control
These features are configured operator-side — there are no
proxymock web flags for them. The relevant settings live in the
Speedscale operator and inspector ConfigMaps:
| Setting | Where | Default | Effect |
|---|---|---|---|
WITH_INSPECTOR | Operator ConfigMap | true | Deploys the inspector. Setting it false removes the inspector entirely from the cluster — see High security mode. With no inspector, the detail drawer and Resources tab don't appear. |
HTTP_ENABLED | Inspector ConfigMap | true | The inbound REST endpoint proxymock web reads. Set it false to disable just the detail/resource views while leaving the inspector running for its cloud-facing duties. |
SECRET_ACCESS_LIST | Operator ConfigMap | empty | Comma-separated allowlist of Secret names. Empty = all Secrets listable (keys-only). Non-empty = Secret listing disabled; only the named Secrets are individually readable (keys-only). See Secrets. |
The inspector's REST listen port is fixed — proxymock web discovers the
pod by label and dials it, so there's no port to configure.
Troubleshooting the workload and resource views
-
The detail drawer or Resources tab never appears. The inspector isn't reachable. Either it isn't deployed (
WITH_INSPECTOR=falseor an older operator), its REST endpoint is off (HTTP_ENABLED=false), or the port-forward couldn't be established. Confirm the inspector is running:kubectl get deploy speedscale-inspector -n speedscale -
A tab shows a permission error (403 / not found). The inspector's ServiceAccount is missing RBAC for that resource. This is expected for Secrets when an allowlist is in effect (see below); for other resources it points to a customized or stripped-down operator RBAC.
-
Secrets show "restricted" or a Secret is missing. An
SECRET_ACCESS_LISTallowlist is set and the Secret isn't on it. This is the intended behavior, not a bug — widen the allowlist (or clear it) operator-side if you need broader visibility. -
Logs are empty right after a crash. With Previous toggled on, an empty result just means there's no prior terminated container to read yet.
What these views do not do
- They never display Secret values — only key names and sizes, by design. The inspector has no mode that returns Secret values.
- Logs are a bounded tail, not a live stream and not full history.
- All reads run in-cluster under the inspector's ServiceAccount. There is no fallback to your local kubeconfig for this data, so visibility is bounded by the inspector's RBAC.