Trace a request without traces
Distributed tracing is great when every service is instrumented, nothing is sampled away, and the request never crosses a system you don't own. When one of those isn't true — the trace was sampled out, a library dropped the context, or the hop went through a third party — you get a waterfall with a hole in it right where the bug is.
But the journey still happened on the wire, and proxymock already recorded it. This guide shows how to reconstruct one customer's full path across four services using the identifier that's already in the traffic — their email — instead of a trace ID.
The result is a Grafana-style waterfall, scoped to a single person, built from real recorded requests:
What you'll need
- proxymock installed (installation).
- Node.js 18+ and
git. - The user-journey demo from the Speedscale demo repo,
under
scenarios/otel-trace-replay-gate/user-journey/. It's a four-service checkout app —gateway → auth,gateway → orders,orders → shipping— that threads the customer's email through anX-User-Emailheader, the request bodies, and the response bodies. Nothing in it uses OpenTelemetry.
Step 1 — Get the demo
Clone the demo repo and move into the user-journey scenario:
git clone https://github.com/speedscale/demo.git
cd demo/scenarios/otel-trace-replay-gate/user-journey
Step 2 — Record the traffic
From that user-journey/ directory:
npm install
./record-all.sh
record-all.sh starts one proxymock record per service into a single shared
workspace and drives ~40 checkouts for five named customers (Ada Lovelace, Grace
Hopper, Alan Turing, Katherine Johnson, and Margaret Hamilton). Every request and
response on every hop is captured to disk as real traffic — no application code
changes required.
Step 3 — Open the recording
proxymock web --in .
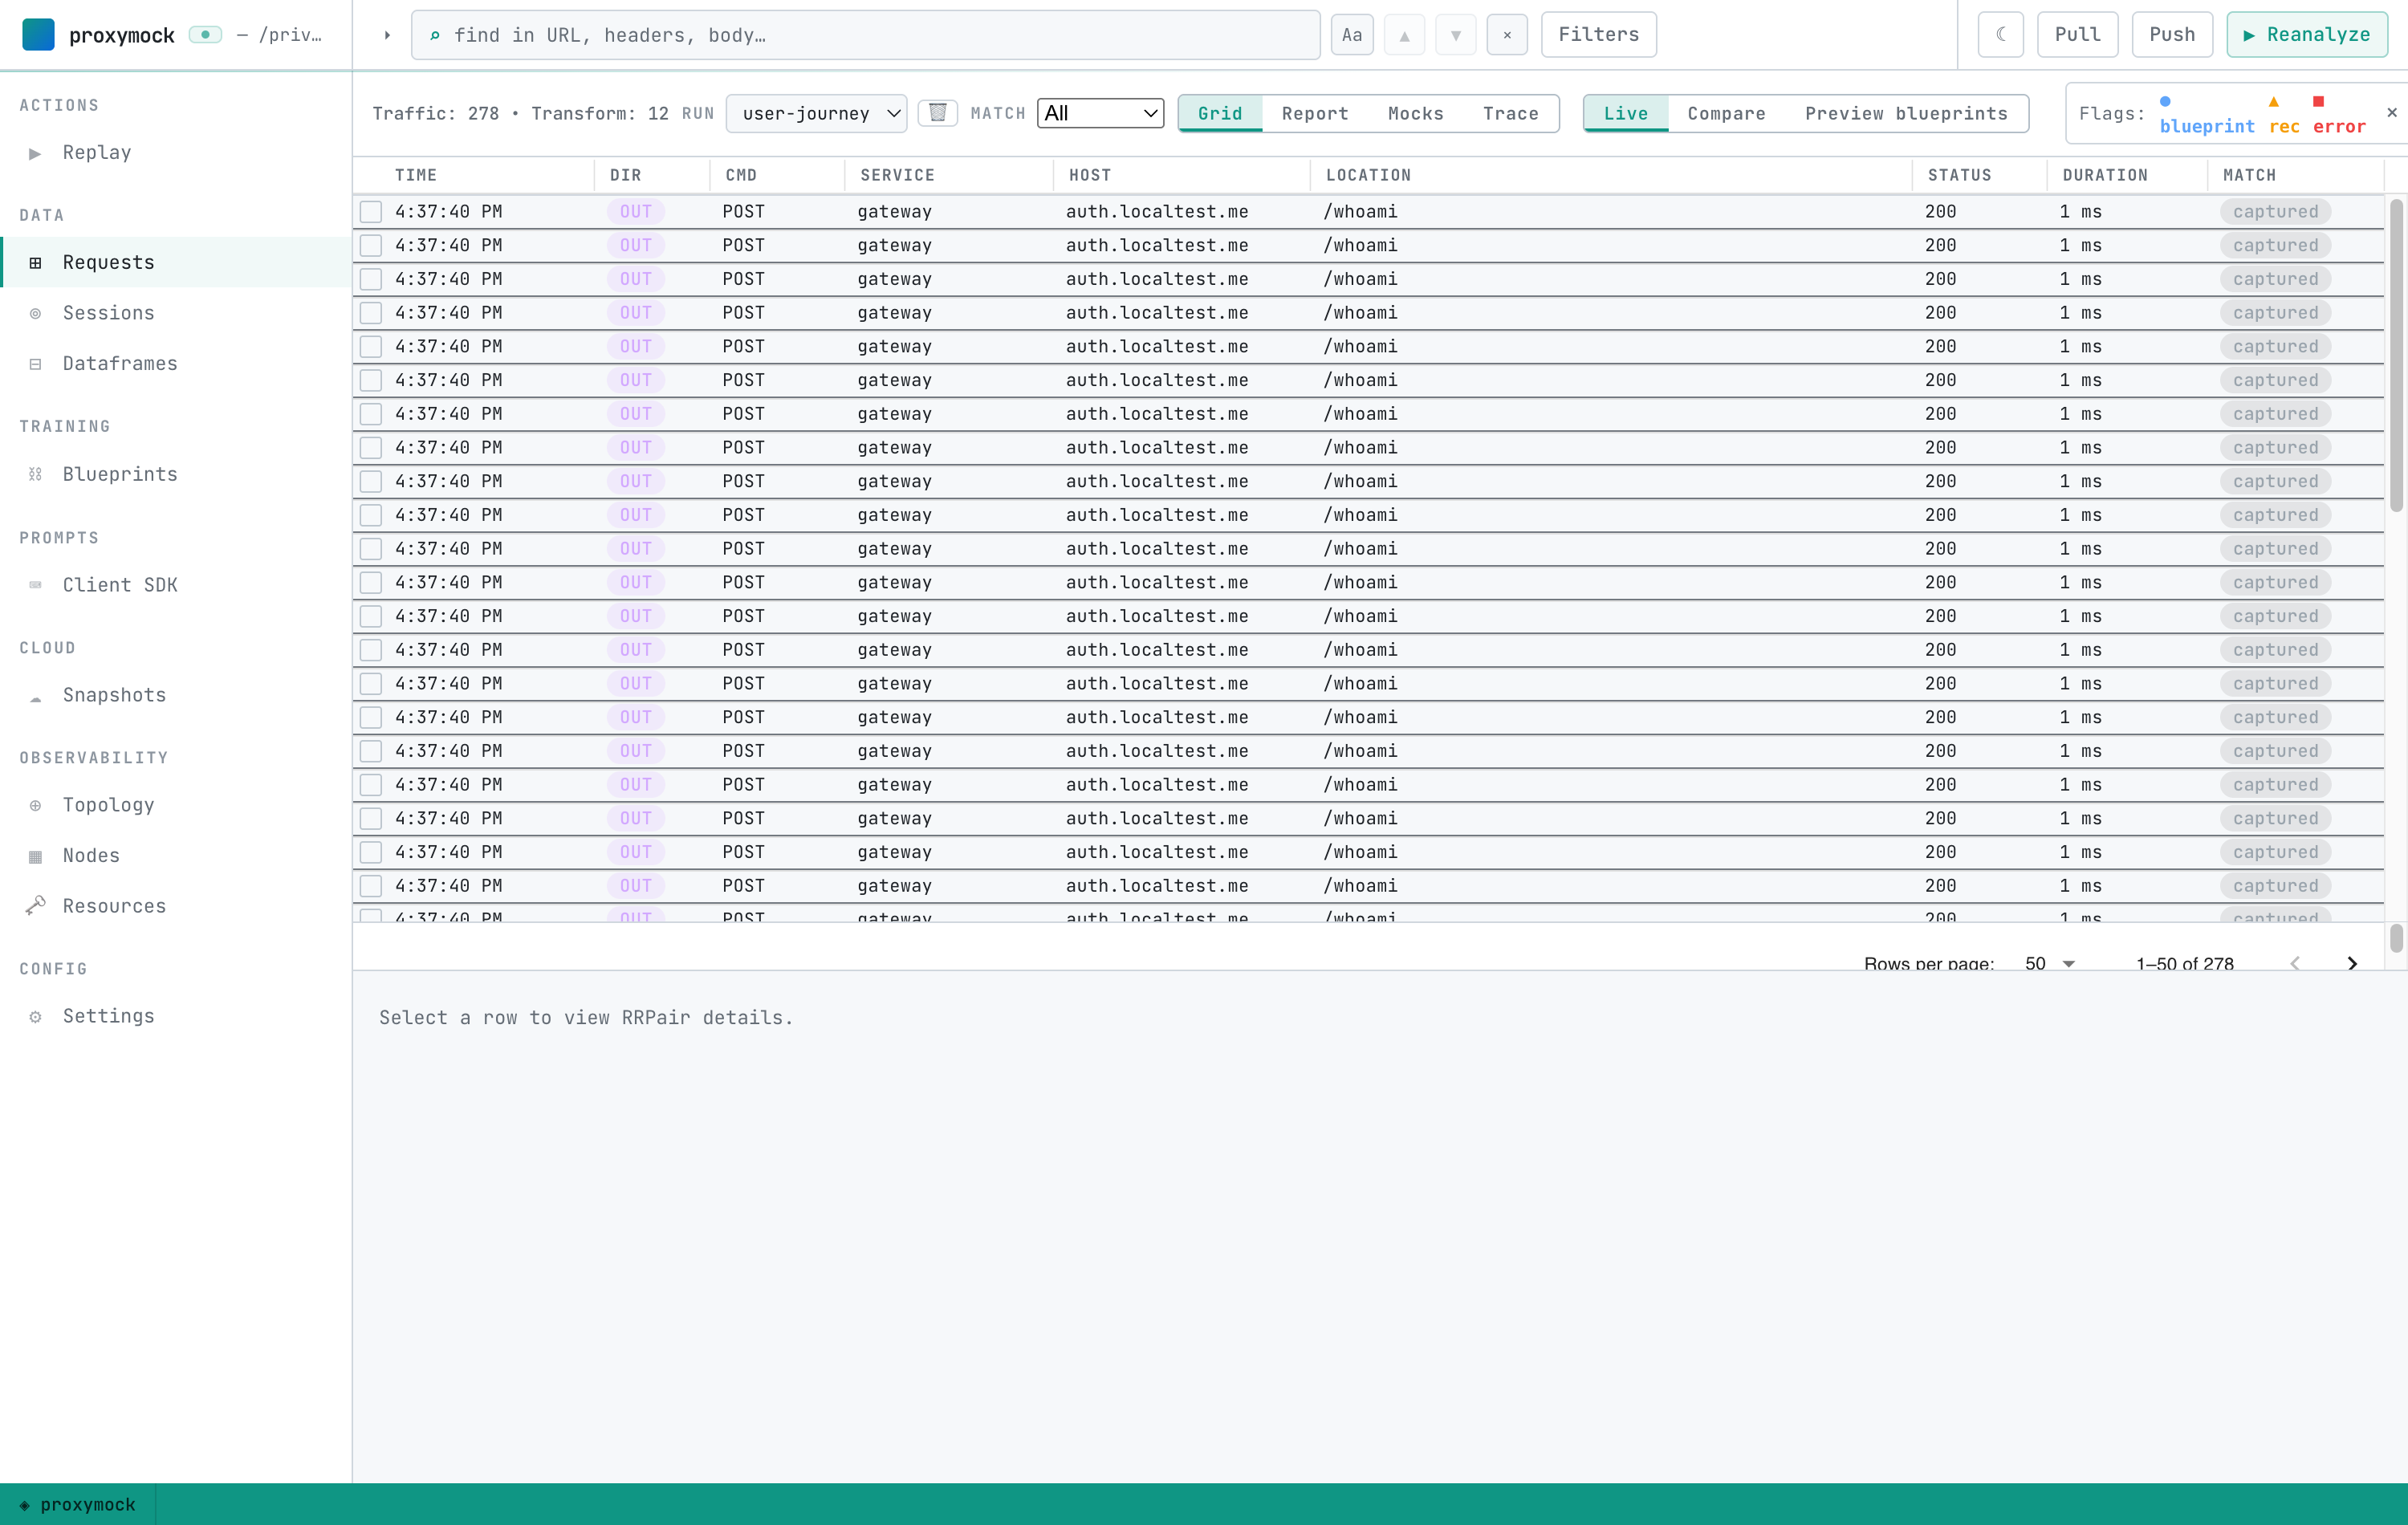
proxymock web opens on the whole recording — every customer's traffic,
interleaved. This is the haystack: hundreds of requests across all four services.
Step 4 — Filter to one customer
You don't need a trace ID to find one person — you need something that travels with their requests. Here that's their email, and it shows up in different places on different hops: a header on one, a request body on another, a response body on a third. The Full Text filter matches against the entire request/response pair, so one filter catches all of them.
Open Filters, add a filter, choose the Full Text field with the contains comparator, and enter the customer's email:
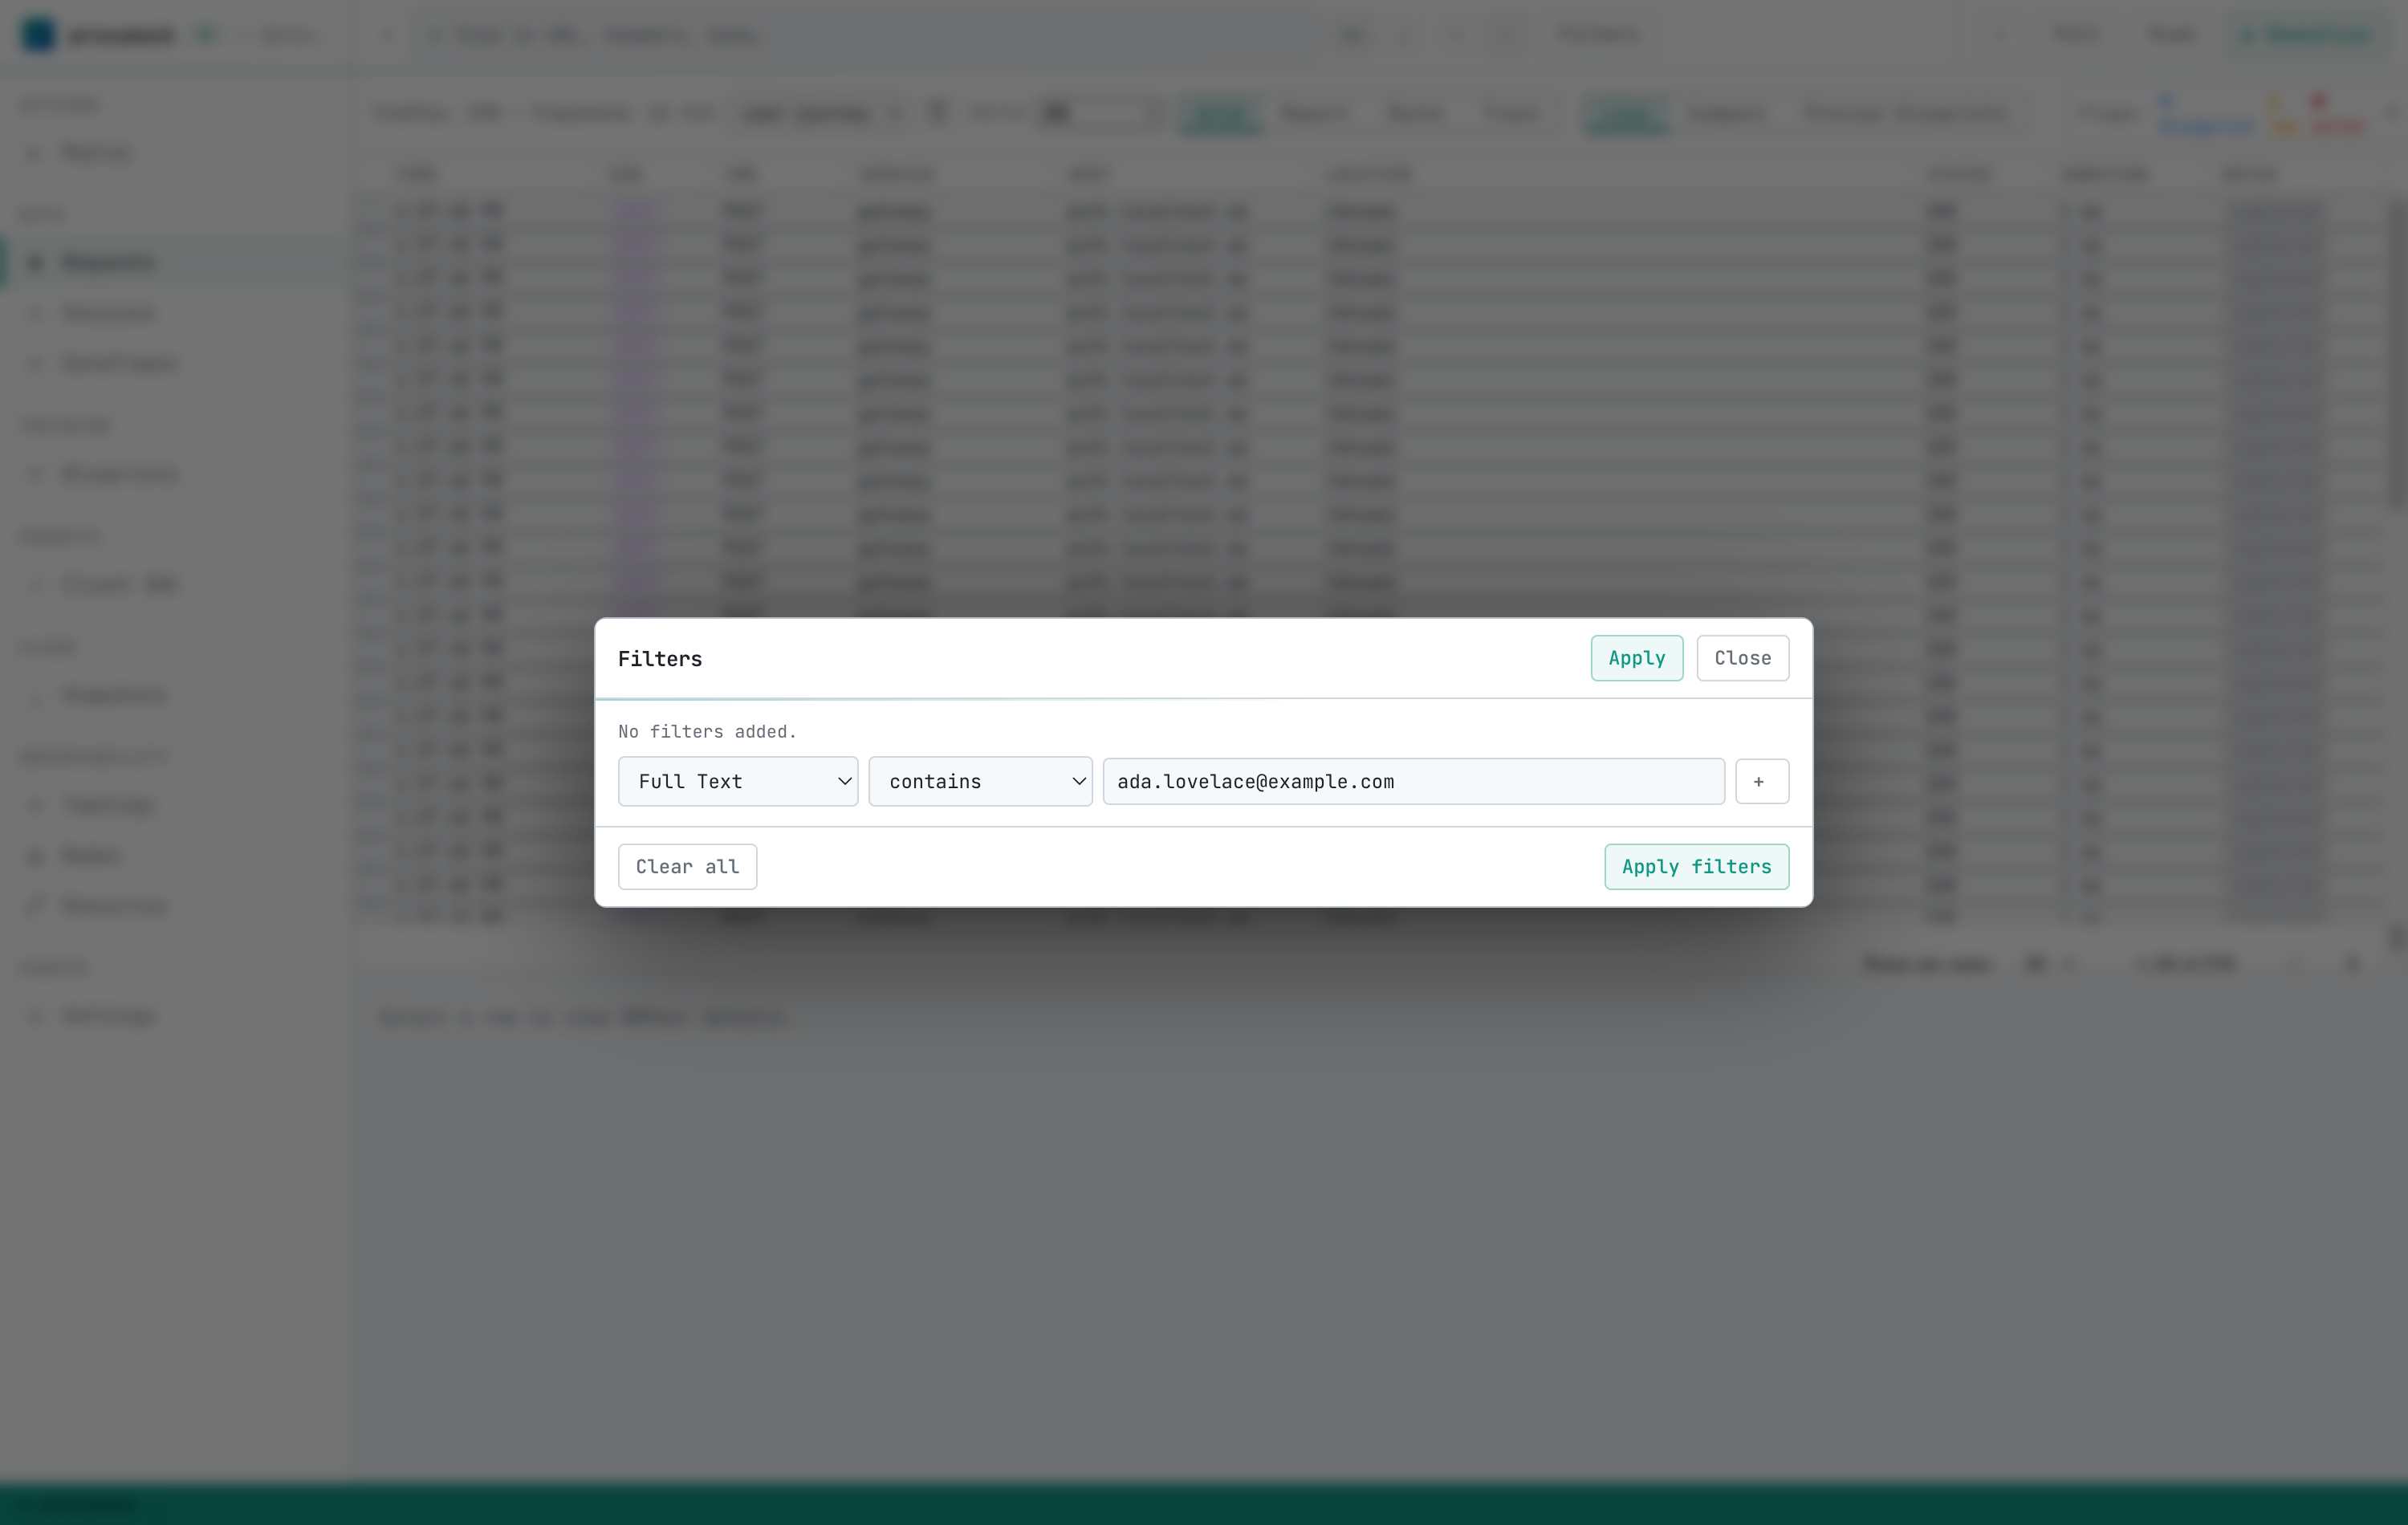
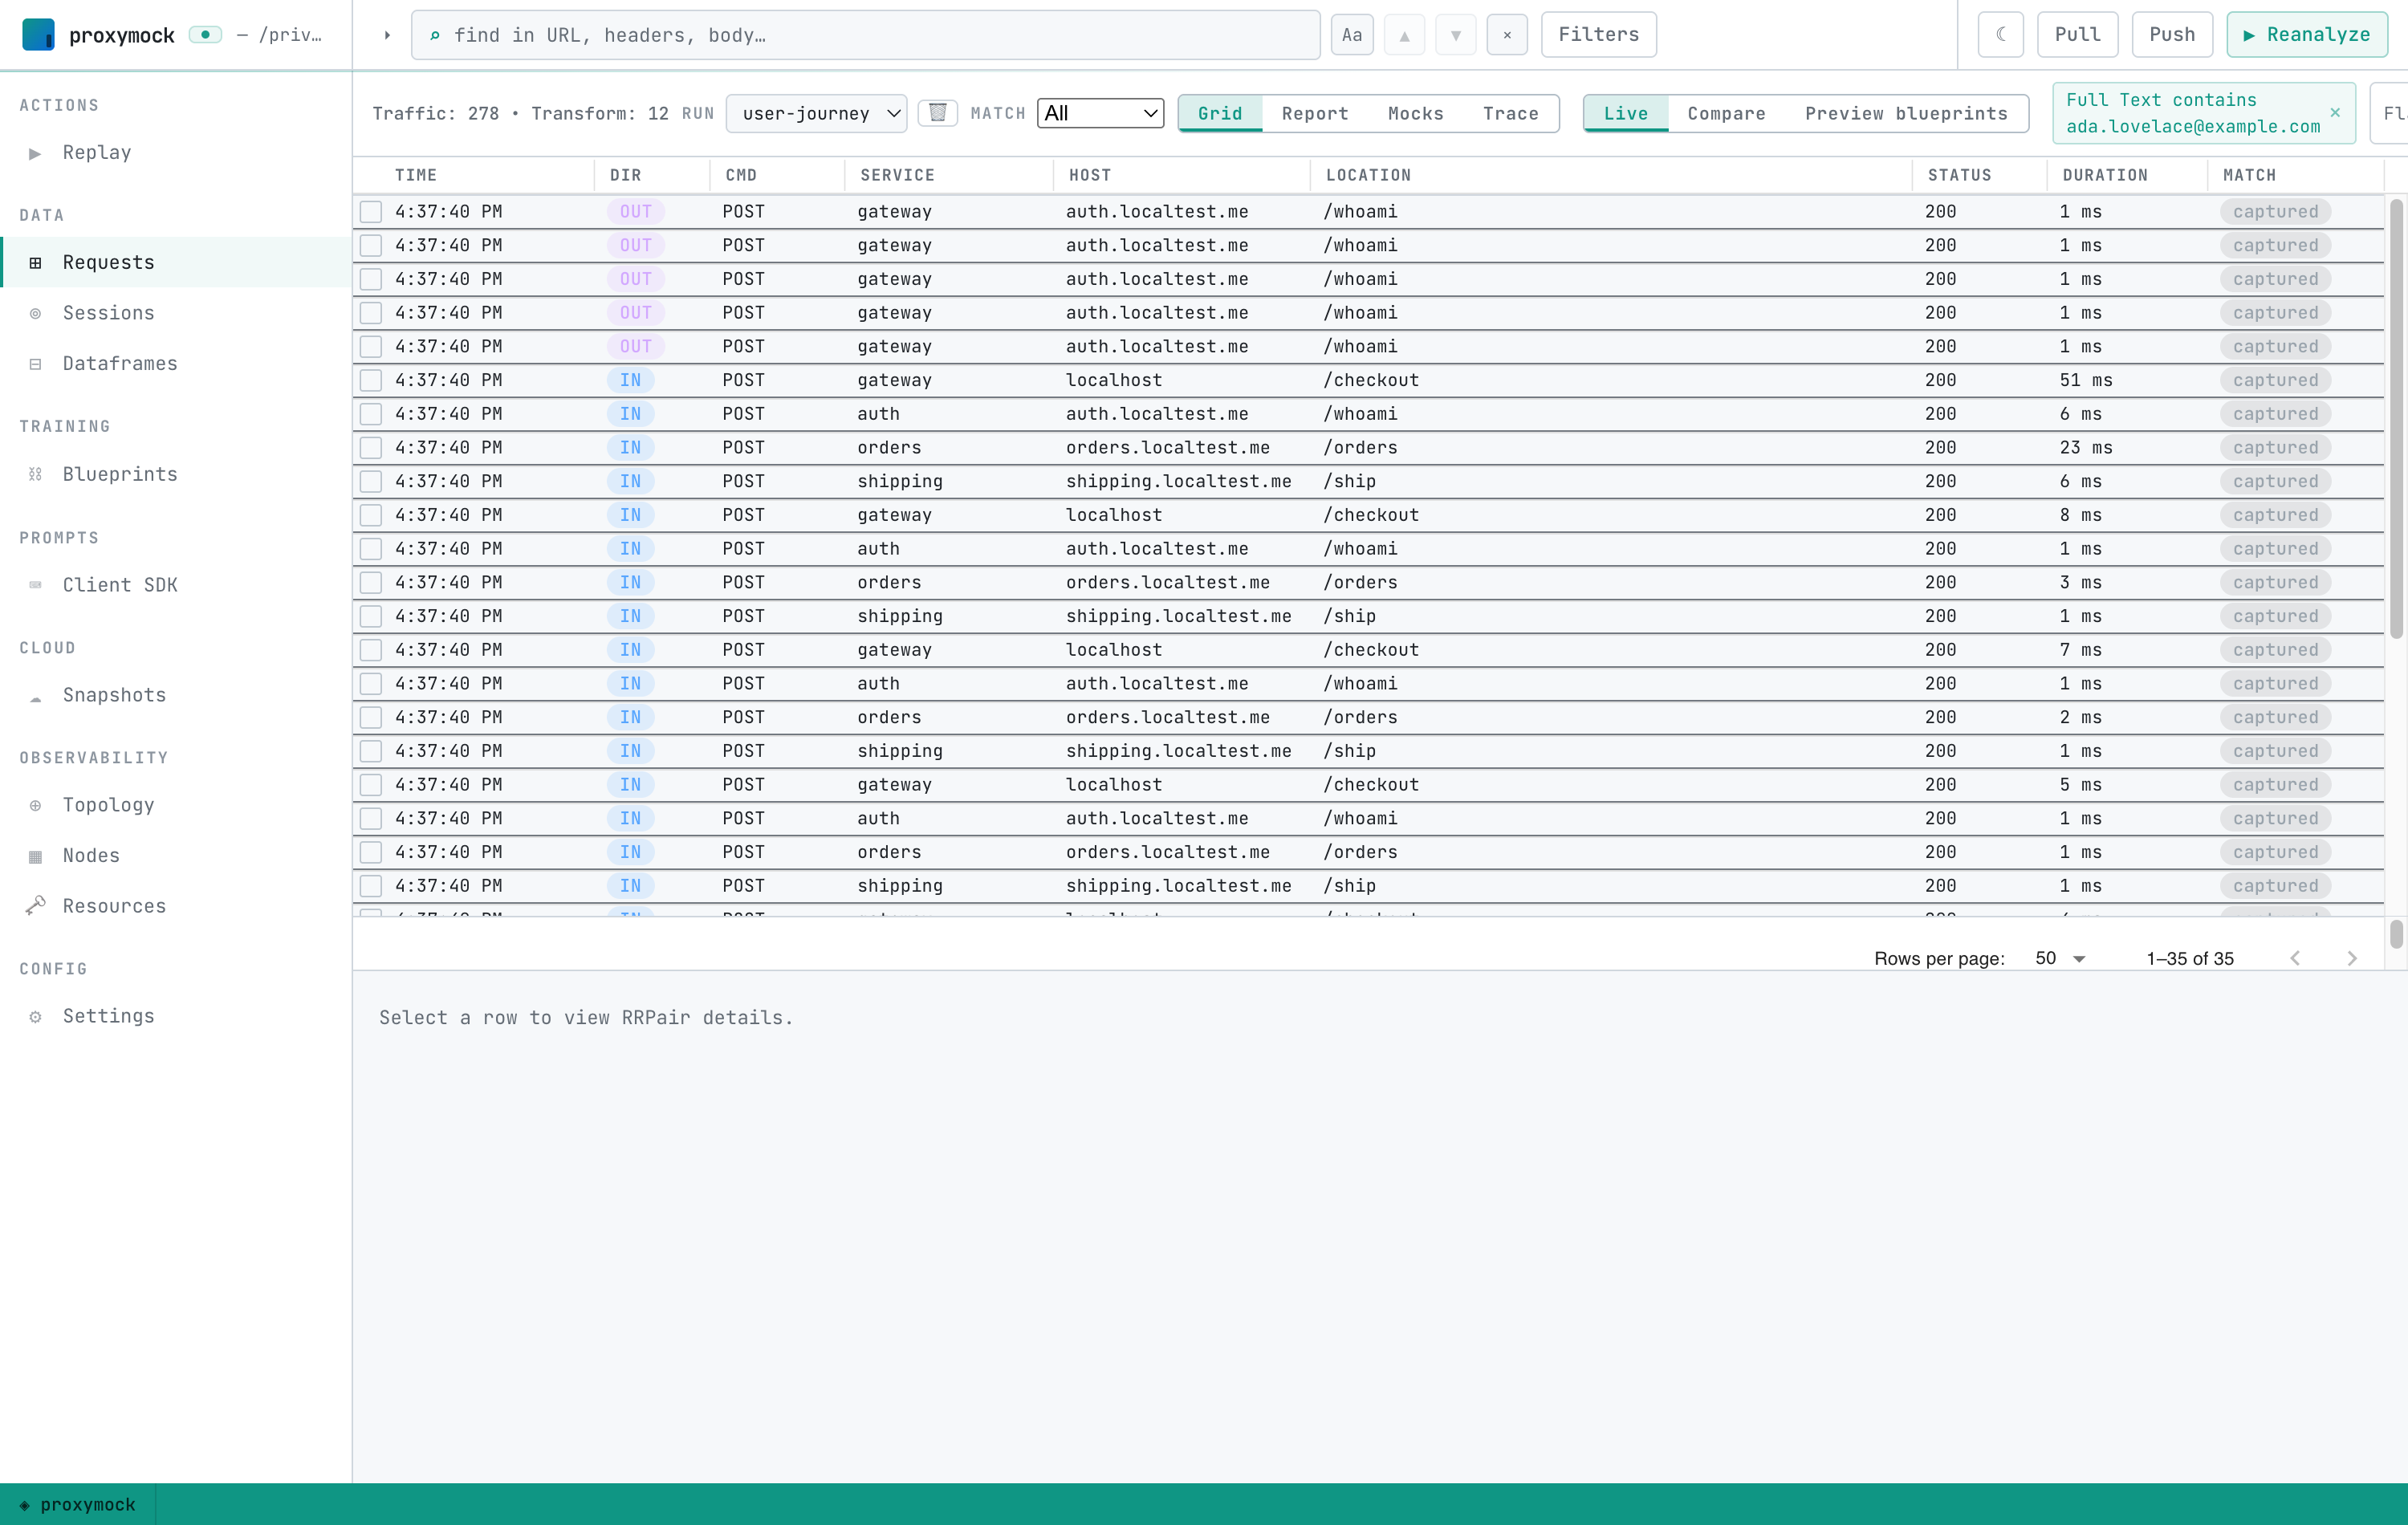
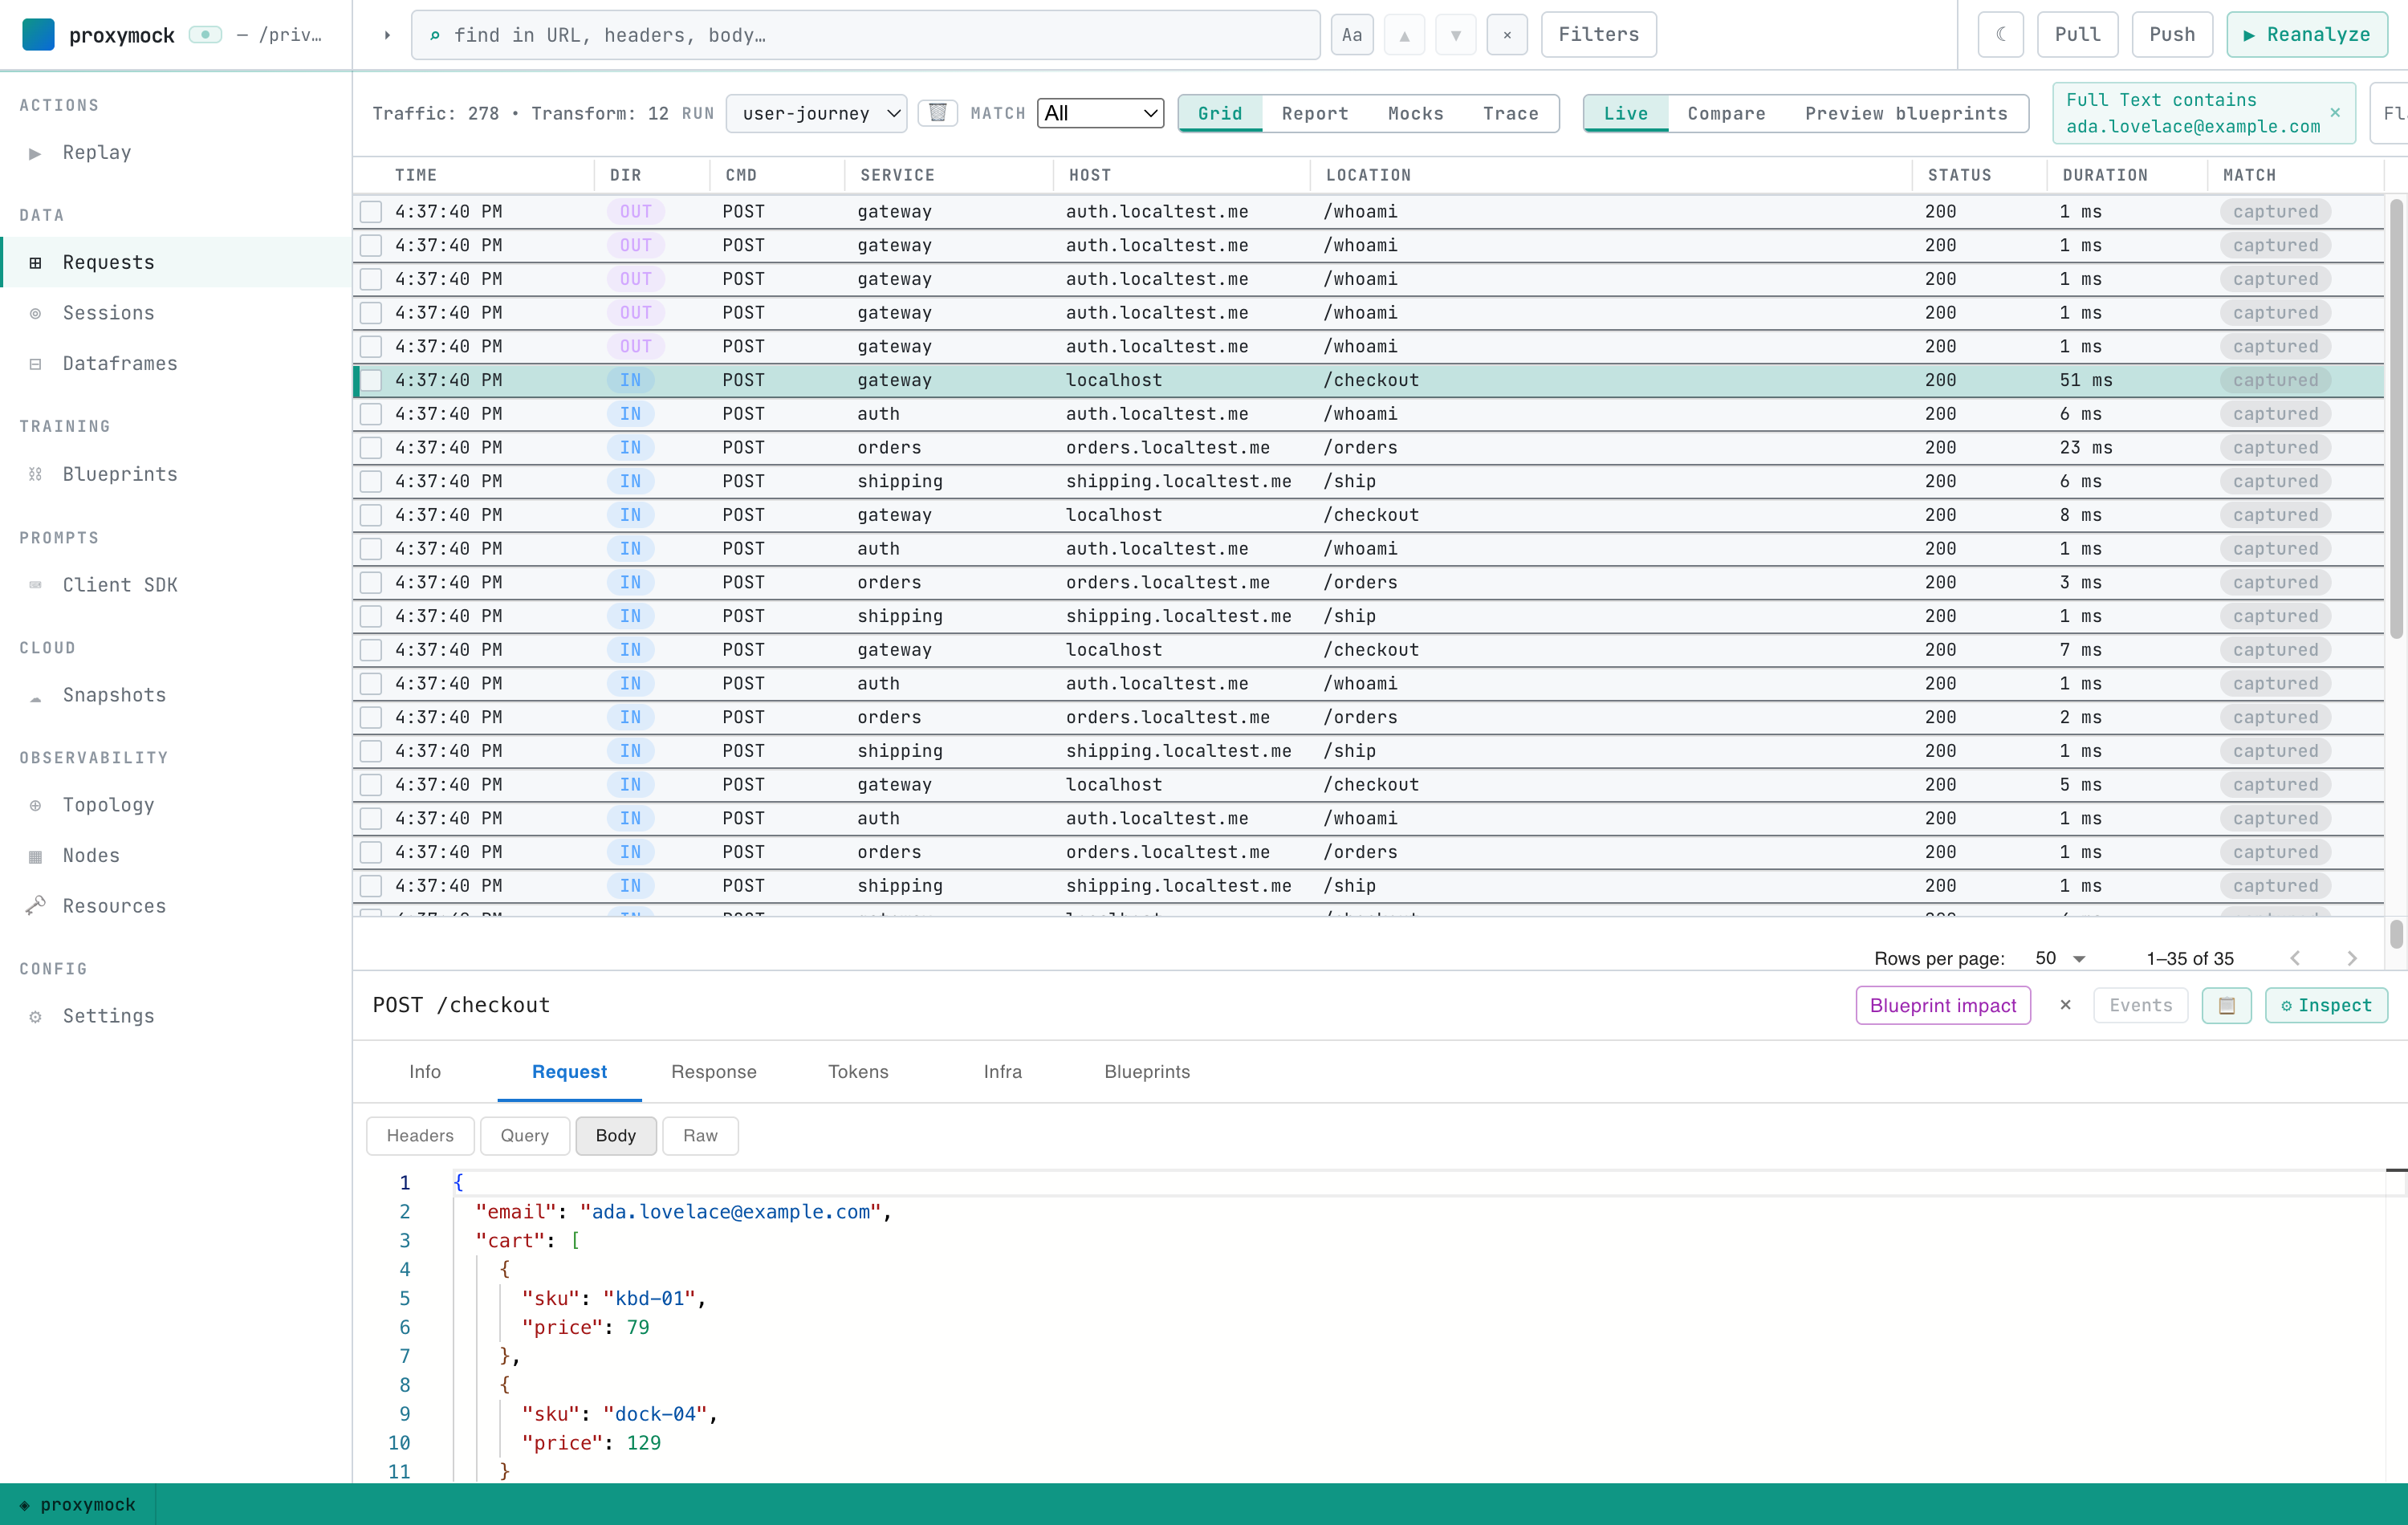
Apply it, and the grid collapses from every customer to just this one — matched across all four services:
Step 5 — See where the identifier was found
Select any row and open the Request tab. On the checkout, the email is in the request body:
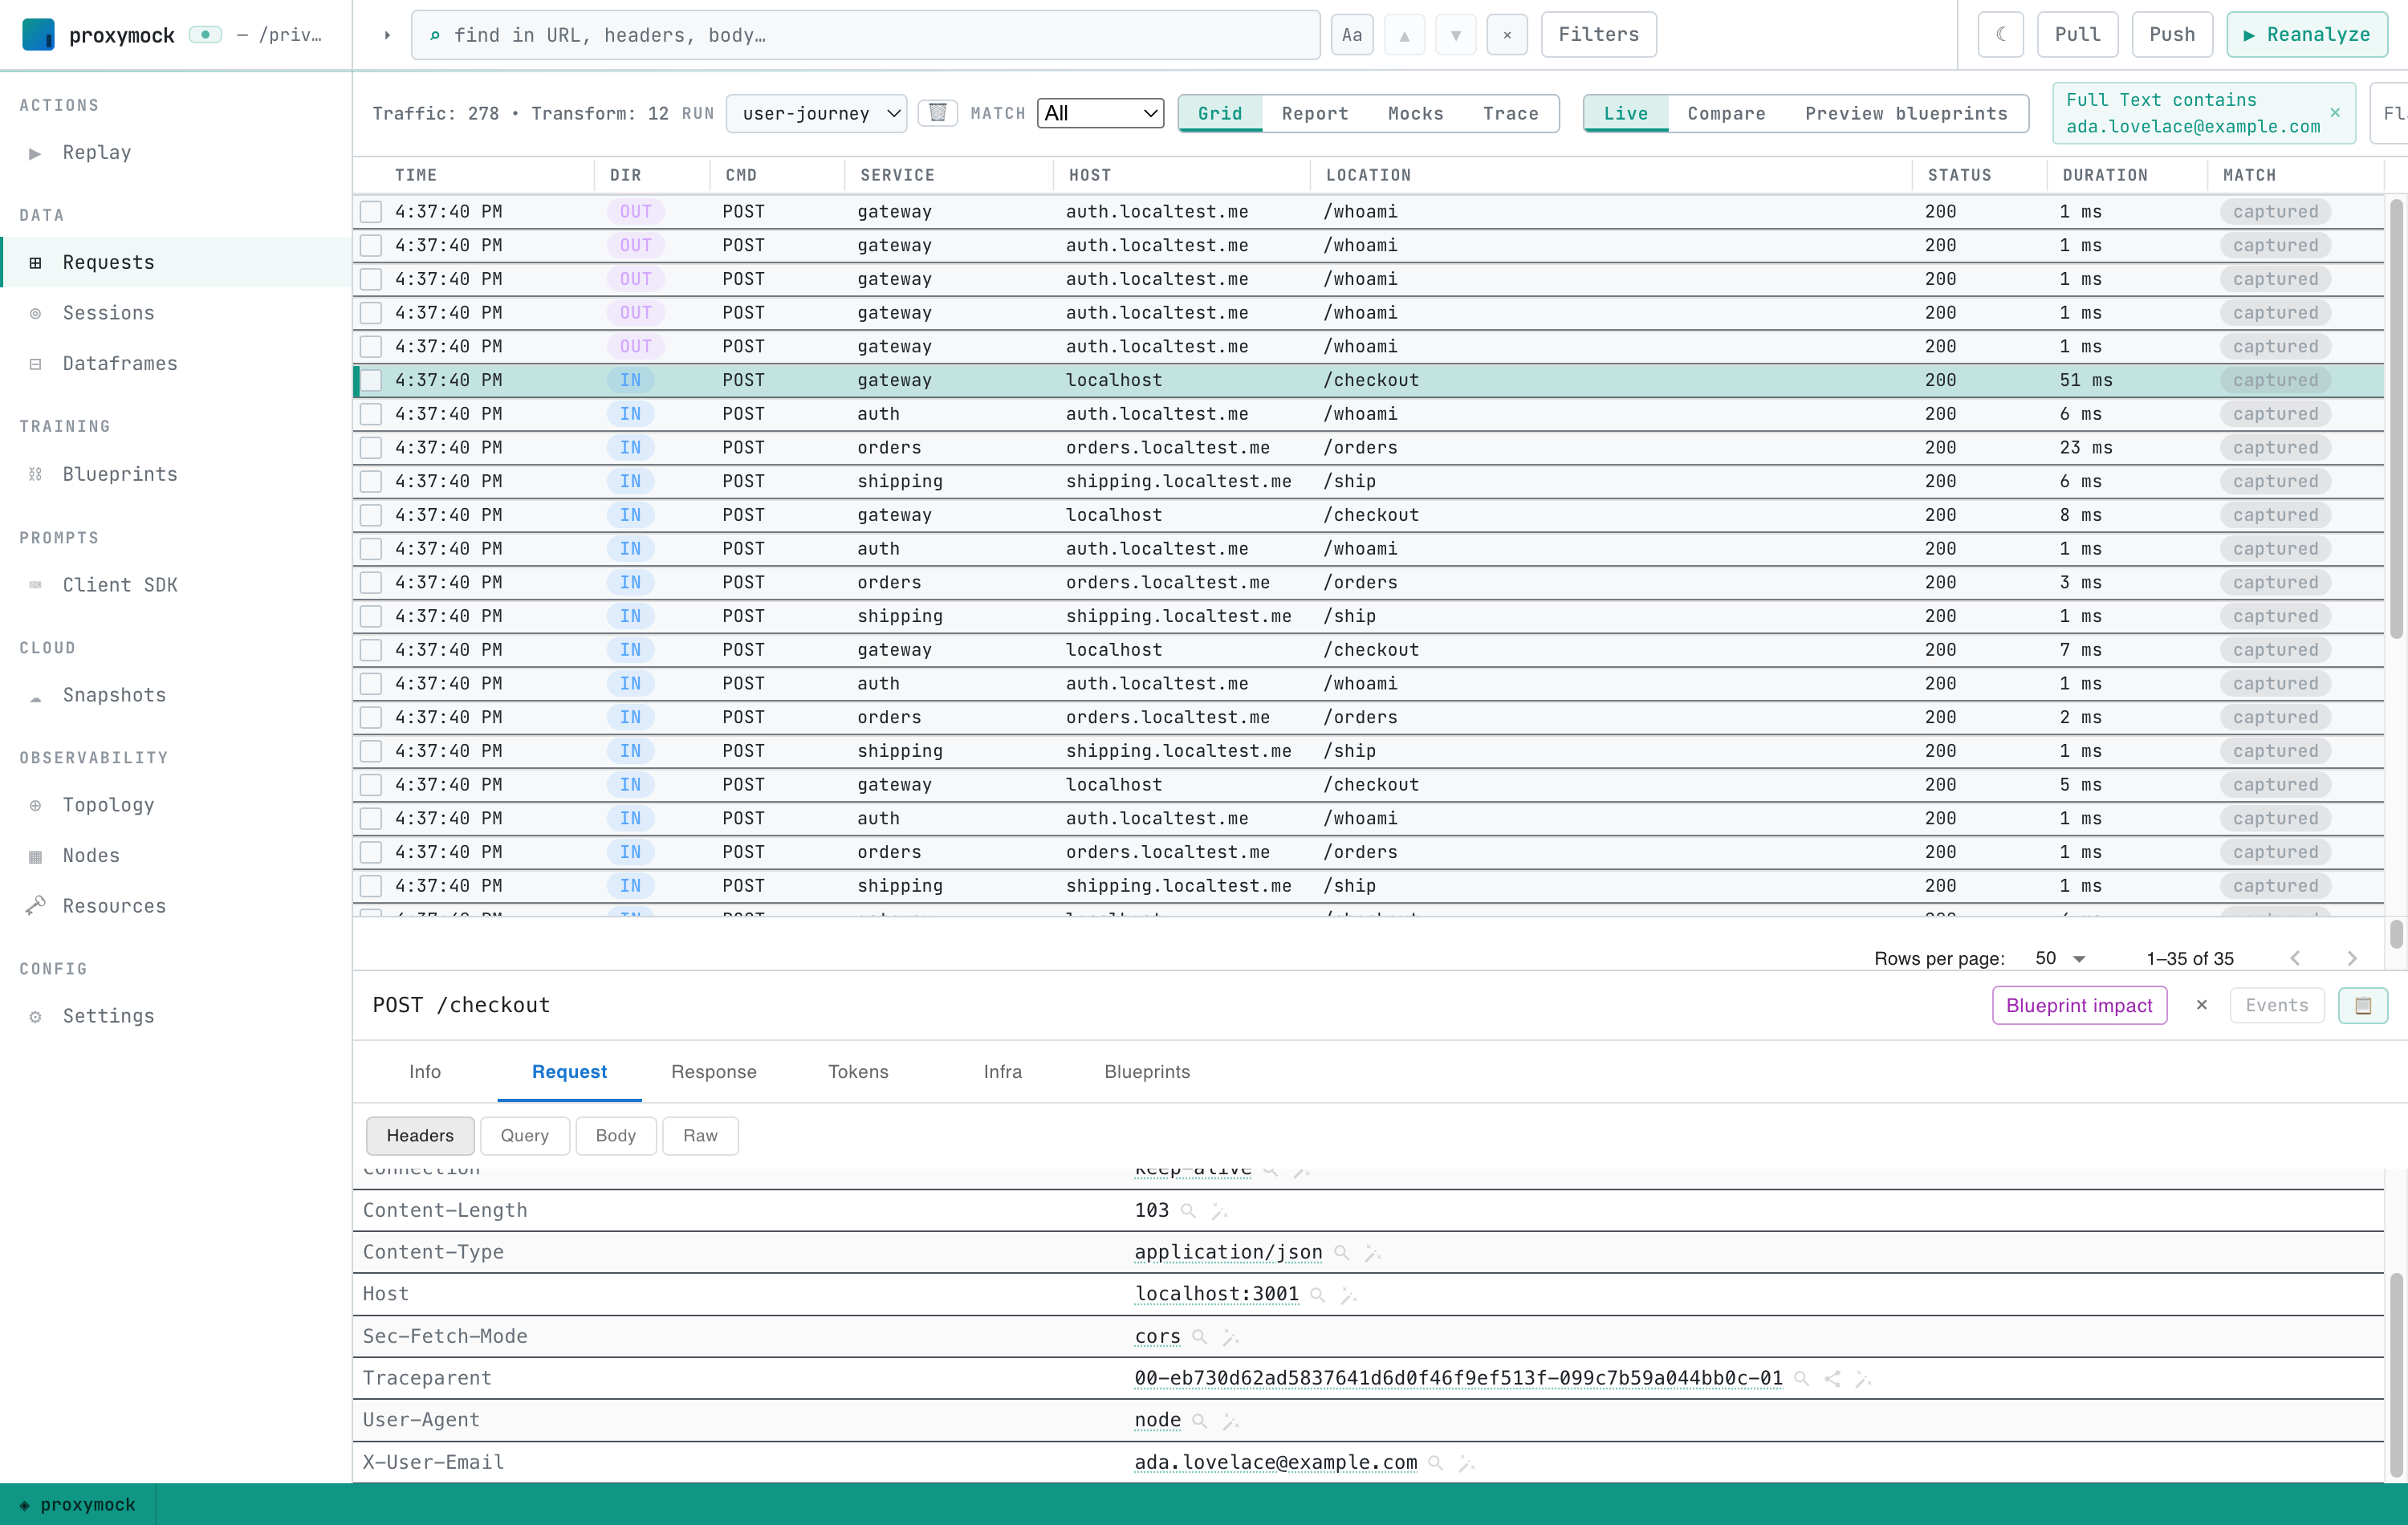
On the Headers sub-tab, the same email rides the X-User-Email header (and a
W3C traceparent is present too — more on that below):
And on the Response tab, downstream services echo the email back in their response bodies:
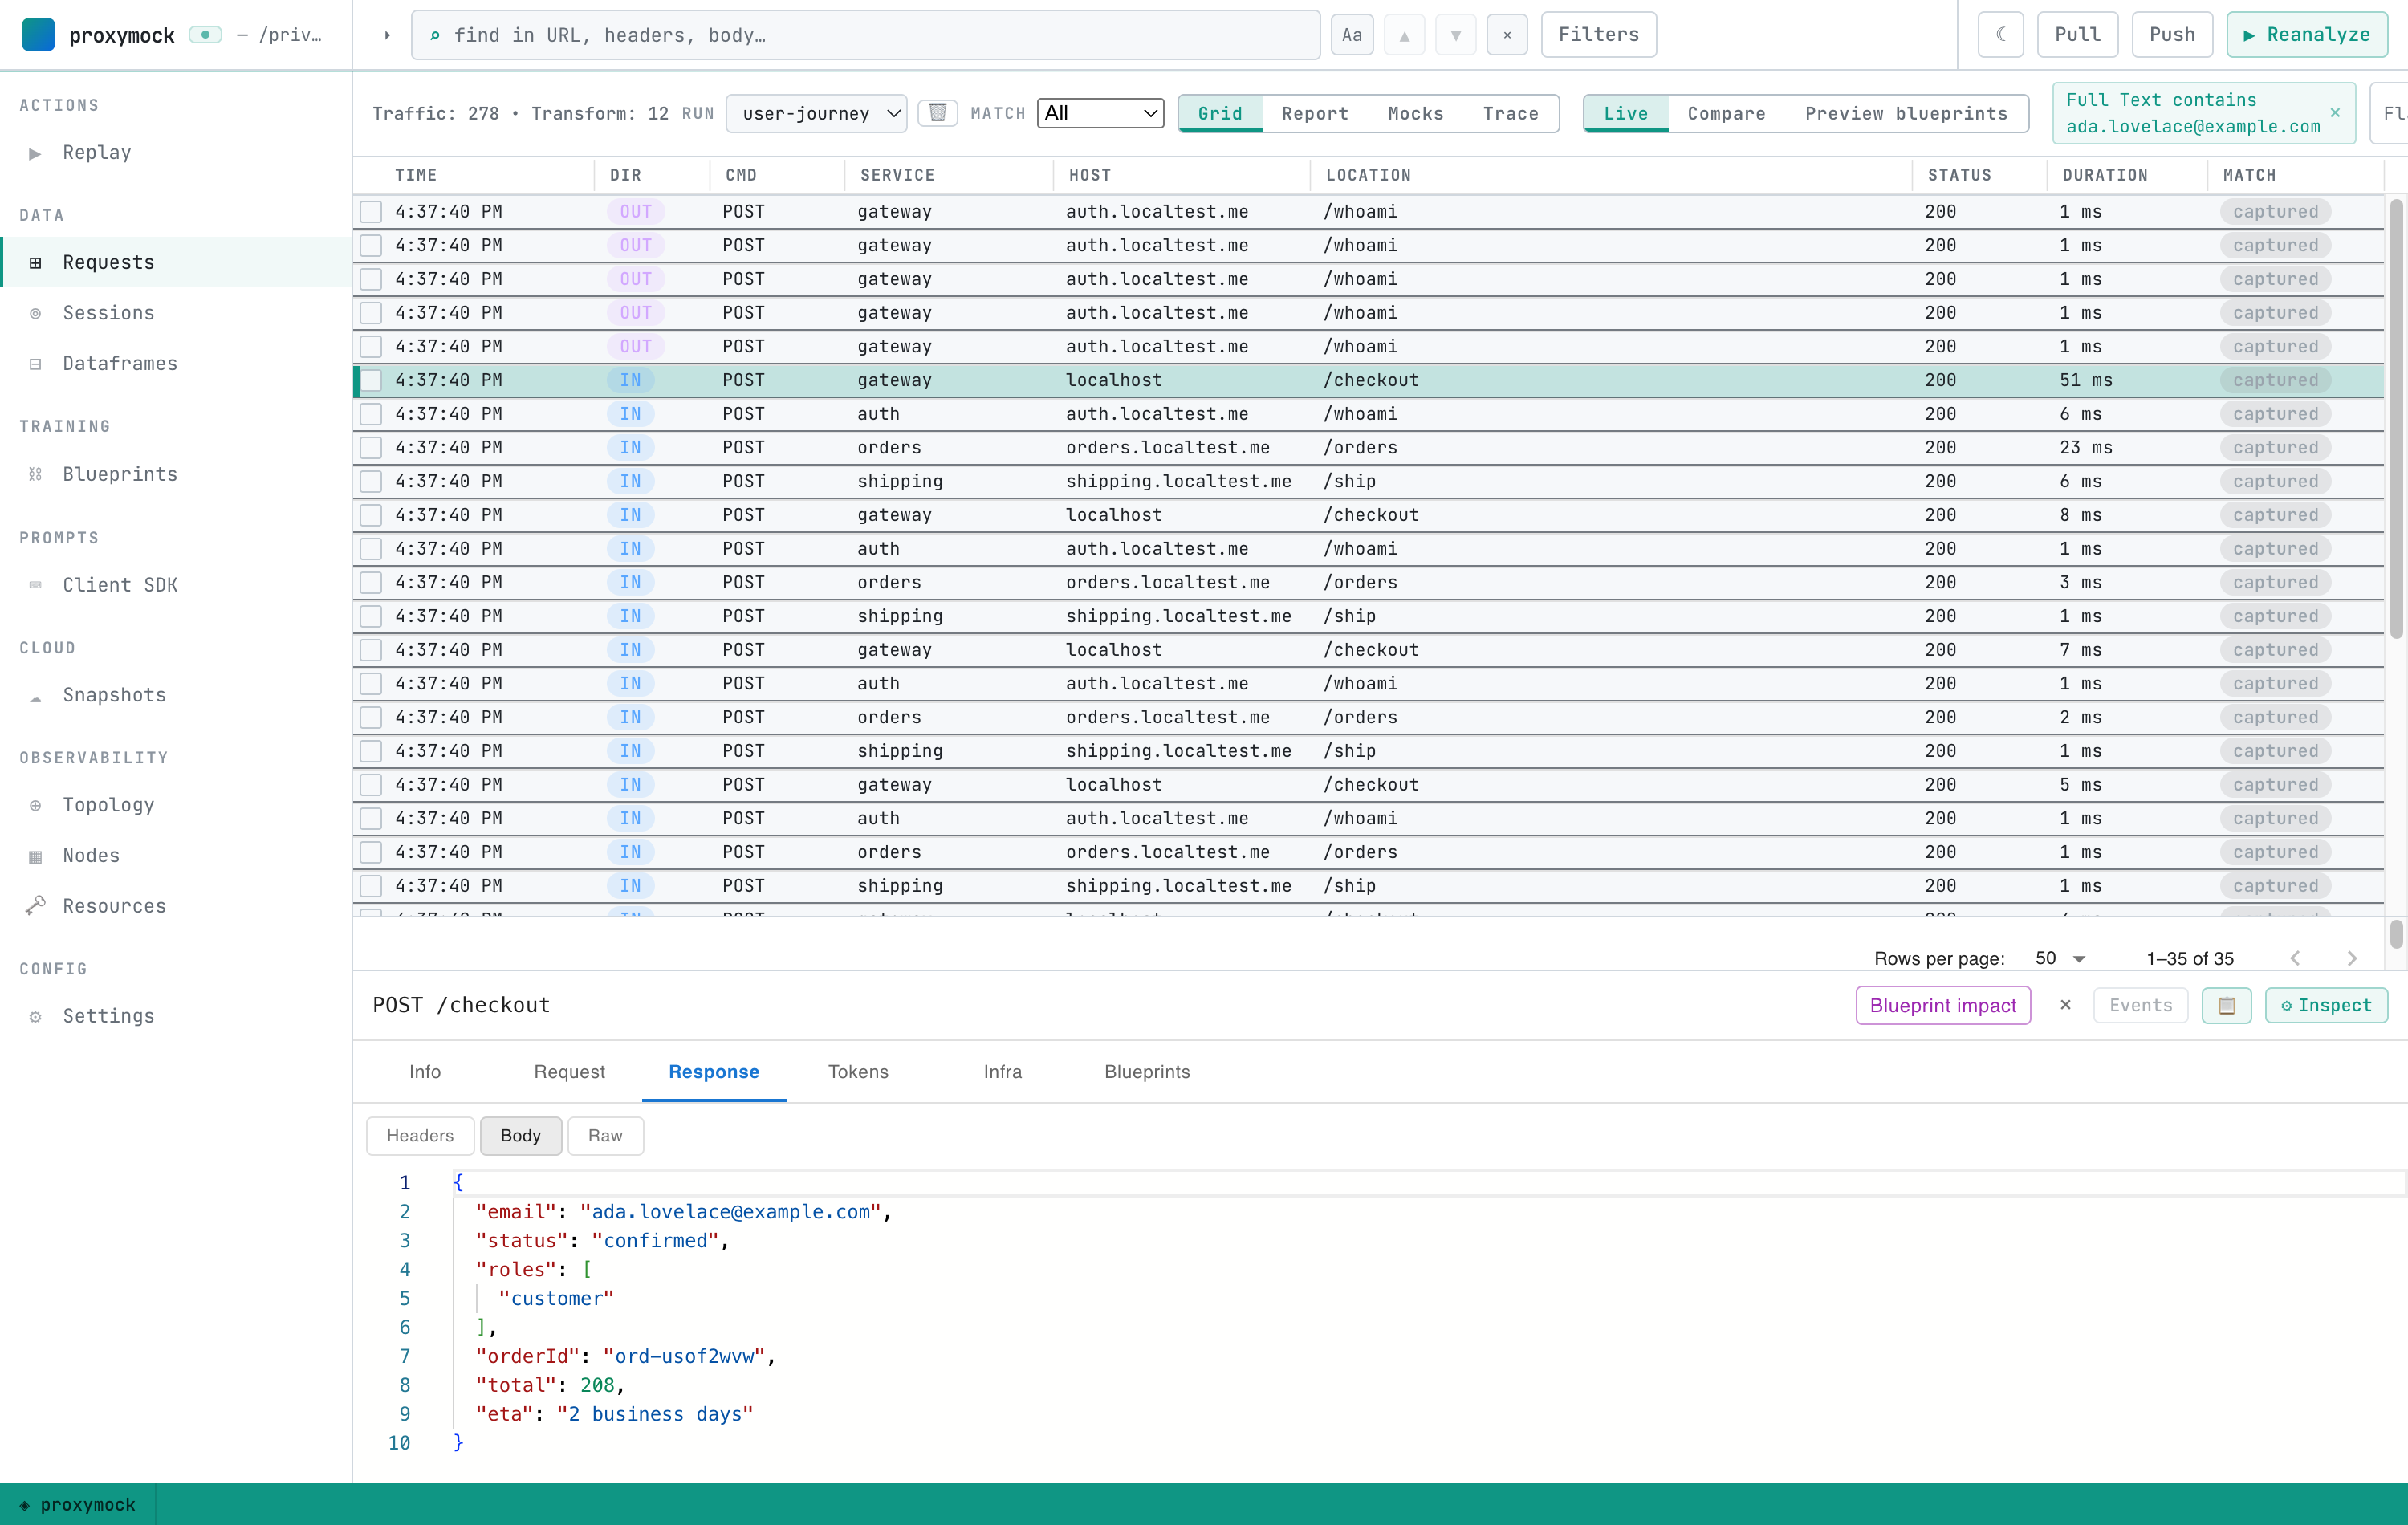
Header, request body, response body — three different fields, across different services, all found by the single Full Text filter. That's the part a trace ID can't do: it only works if every service agreed to propagate it. A business identifier survives across systems that were never instrumented.
Step 6 — Read the waterfall
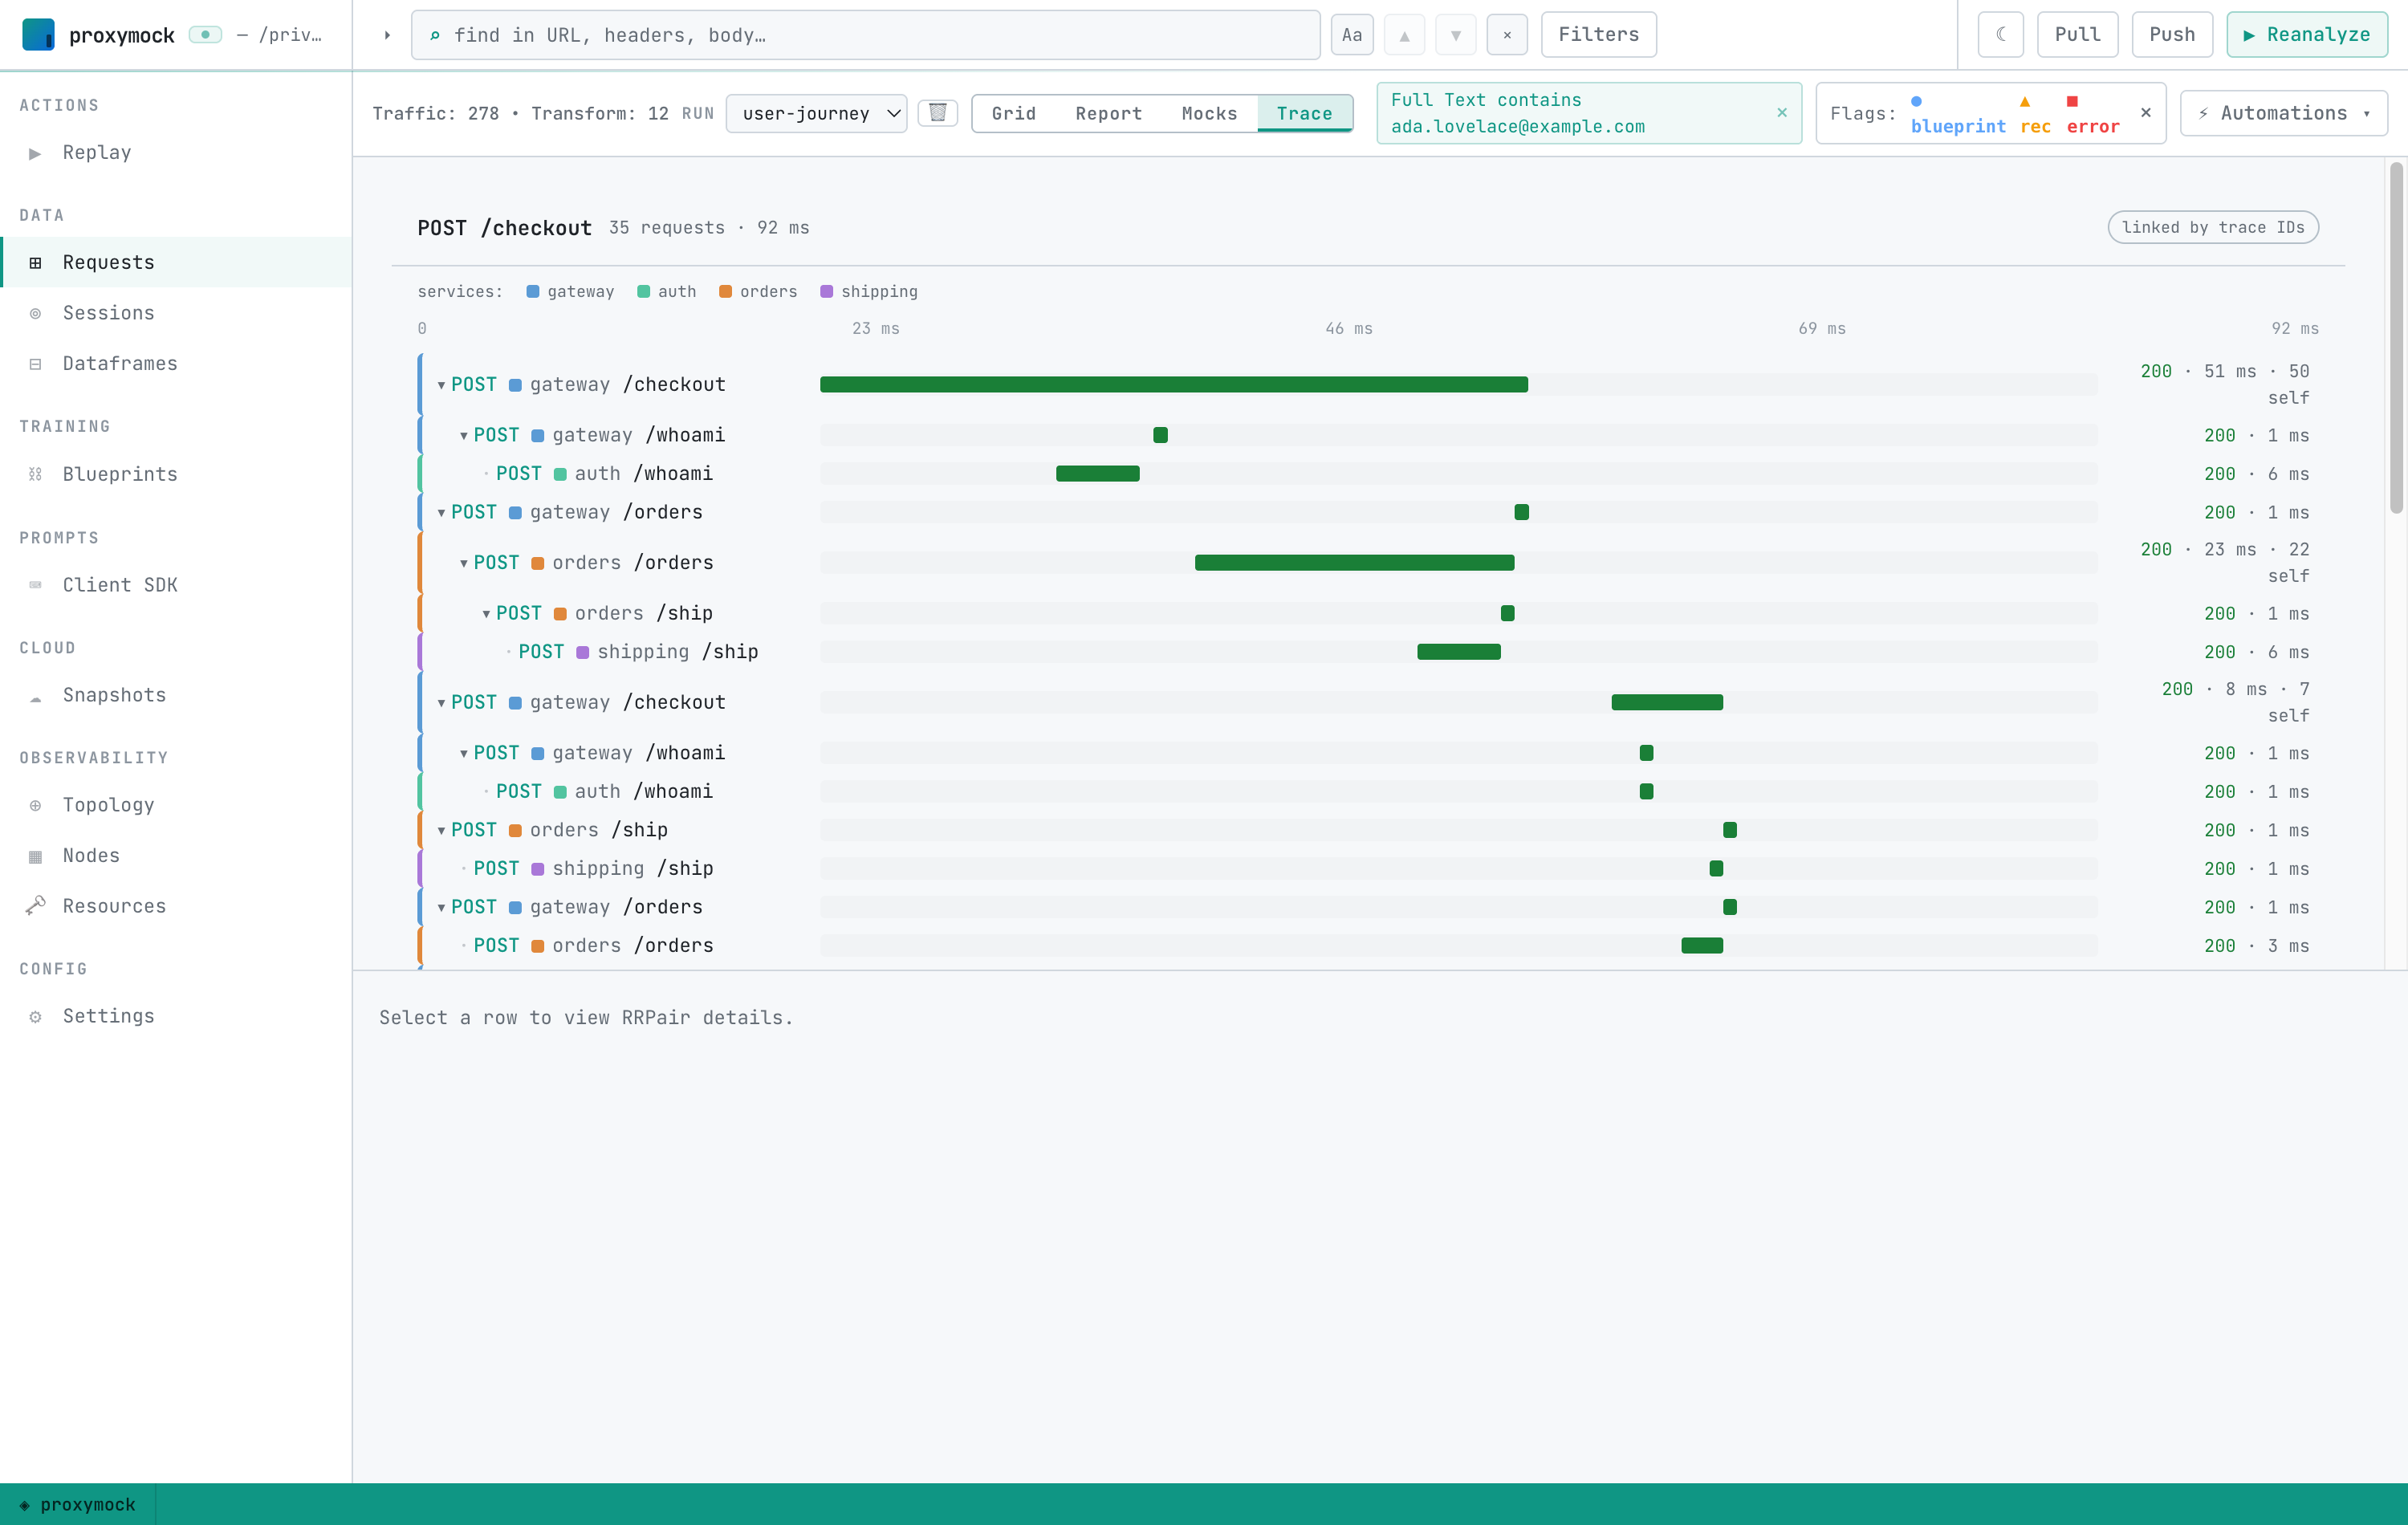
Switch the Requests view to the Trace lens. proxymock draws the filtered set as a time-ordered, nested waterfall — one customer's transaction across every service:
You can read the whole journey top to bottom: the checkout hits the gateway, which calls auth to verify the customer and orders to place the order, and orders calls shipping for a delivery estimate — every hop, in order, with each span's duration and self-time. Because these are the real recorded requests, every bar is clickable and drills into the exact request and response for that customer on that transaction.
How this works
- The filter does the correlation. The Full Text filter narrows the Requests
list, and the Trace lens is a pure renderer over that filtered set (see
the Trace view). Change the email to
grace.hopper@example.comand you get Grace's journey instead. Any value that travels with the request works — an order id, an account number, a session token. traceparentis only used for nesting, never for filtering. The demo propagates a W3Ctraceparentso the waterfall can nest hops into a tree, but you never filter on it. The grouping key is business data, not a trace ID — which is exactly why this works when tracing is missing or incomplete.- Nothing is instrumented. proxymock recorded the wire, not the code. The same recording can also be replayed or turned into mocks — so the traffic that reconstructed this trace can also become a regression test.