Choose Where a Replay Runs
Every replay sends recorded requests at a target and reports how the responses compare. What changes is where the replay runs and what it needs from you. proxymock offers three paths, and they are independent: having a cluster does not stop you replaying locally, and being logged in to Speedscale cloud does not force a replay through it.
| On this machine | In your cluster | Via Speedscale cloud | |
|---|---|---|---|
| Where traffic is sent from | proxymock, in-process | a generator pod the operator creates | a generator pod the operator creates |
| Target | any URL your machine can reach | a workload or Service in the cluster | a workload in a cluster registered with your tenant |
| Needs a kubeconfig | no | yes | no |
| Needs the Speedscale operator | no | yes | yes |
| Needs a Speedscale cloud login | no | no | yes |
| Does anything leave the cluster or laptop | no | no | yes: the recordings are pushed as a snapshot |
| Where the report lands | your workspace | the cluster, read with proxymock | the Speedscale dashboard |
In proxymock web all three live in the Where it runs strip at the top of the Replay tab. Picking one decides what the rest of the form asks for, and the run button changes with it. The Test config picker below it applies to all three paths; see Configure a Replay with Test Configs.
On this machine
The replay runs inside proxymock and sends traffic to a URL. Use it while you are editing code: your service runs locally, the replay hits it directly, and nothing else has to exist.
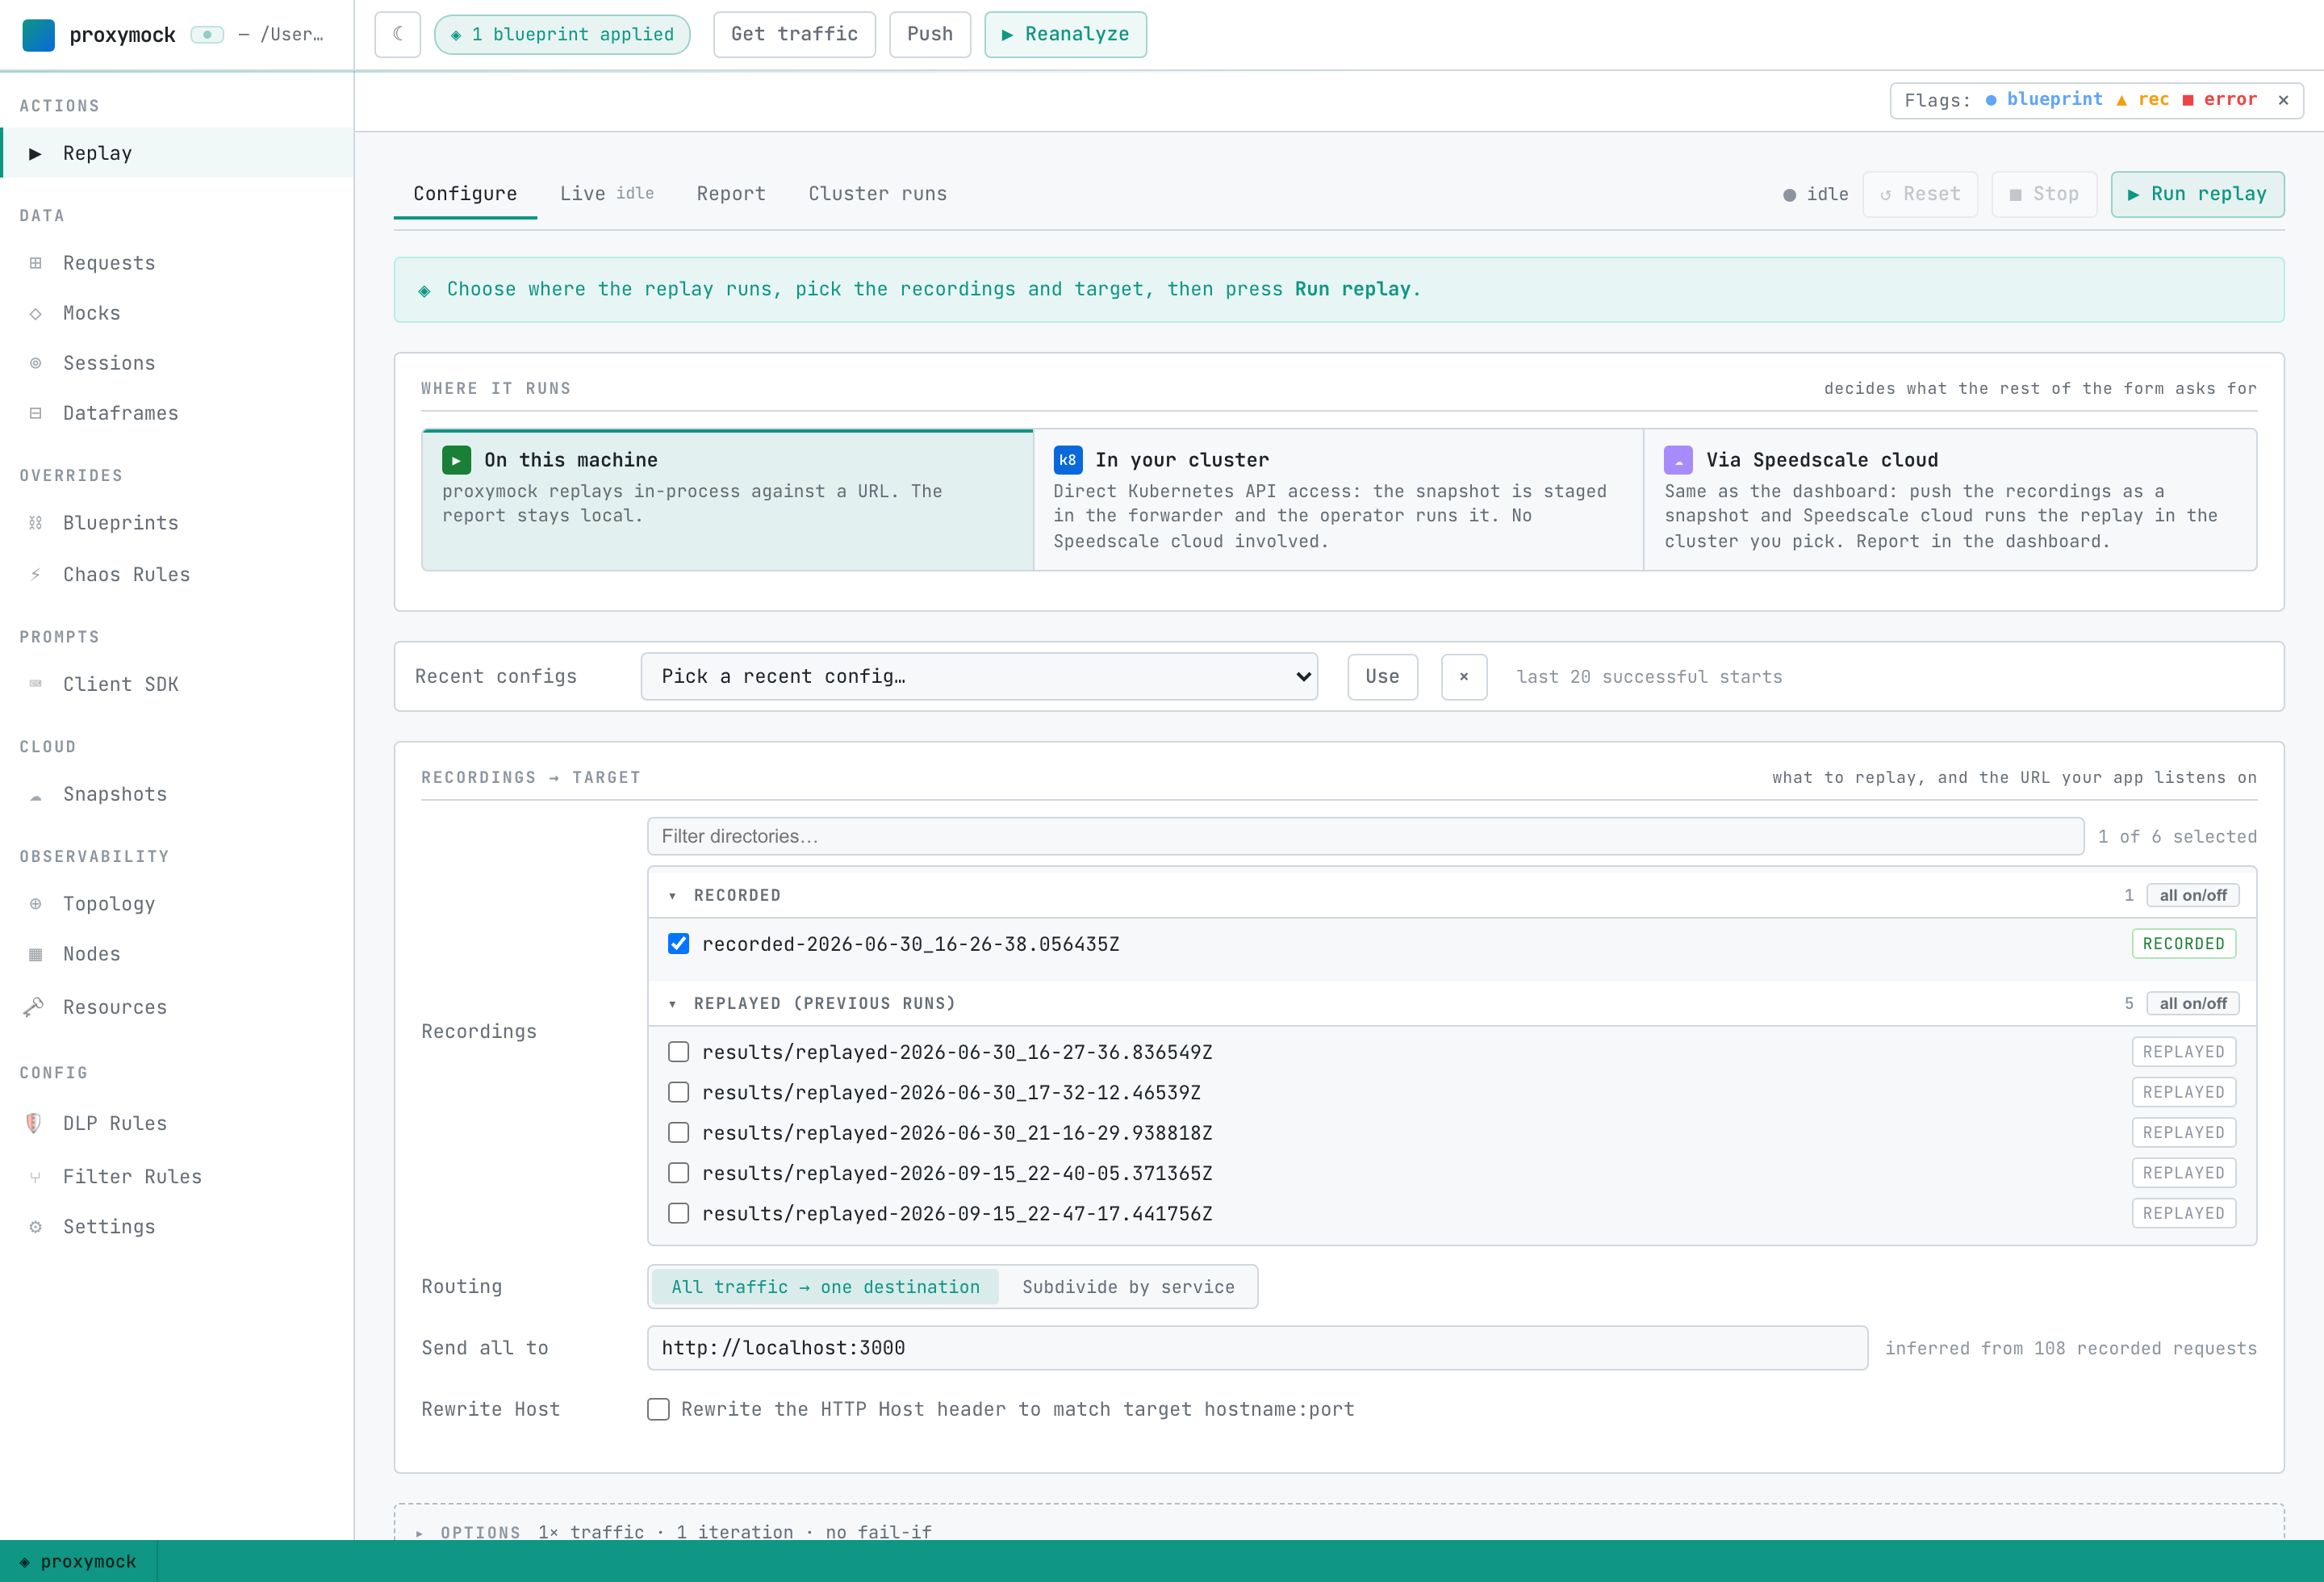
- Start your service so it is listening.
- In the Replay tab pick On this machine.
- Select the recordings to replay.
- Leave routing on All traffic to one destination and set the URL your service listens on.
- Press Run replay.
The same run from the CLI:
proxymock replay --in ./proxymock --test-against localhost:3000
If your service calls dependencies you do not want to reach for real, run proxymock mock alongside it and point the service at the mock. See Mock a dependency.
A replay that cannot open a connection fails with tcp probe against "HOST:PORT": unable to connect. That means nothing was listening, so start the service first.
In your cluster
The replay runs inside Kubernetes against a real workload, and no part of it involves Speedscale cloud. proxymock analyzes the recordings locally, stages the snapshot in the in-cluster forwarder over a port-forward, and the operator runs the replay from there. The report stays in the cluster.
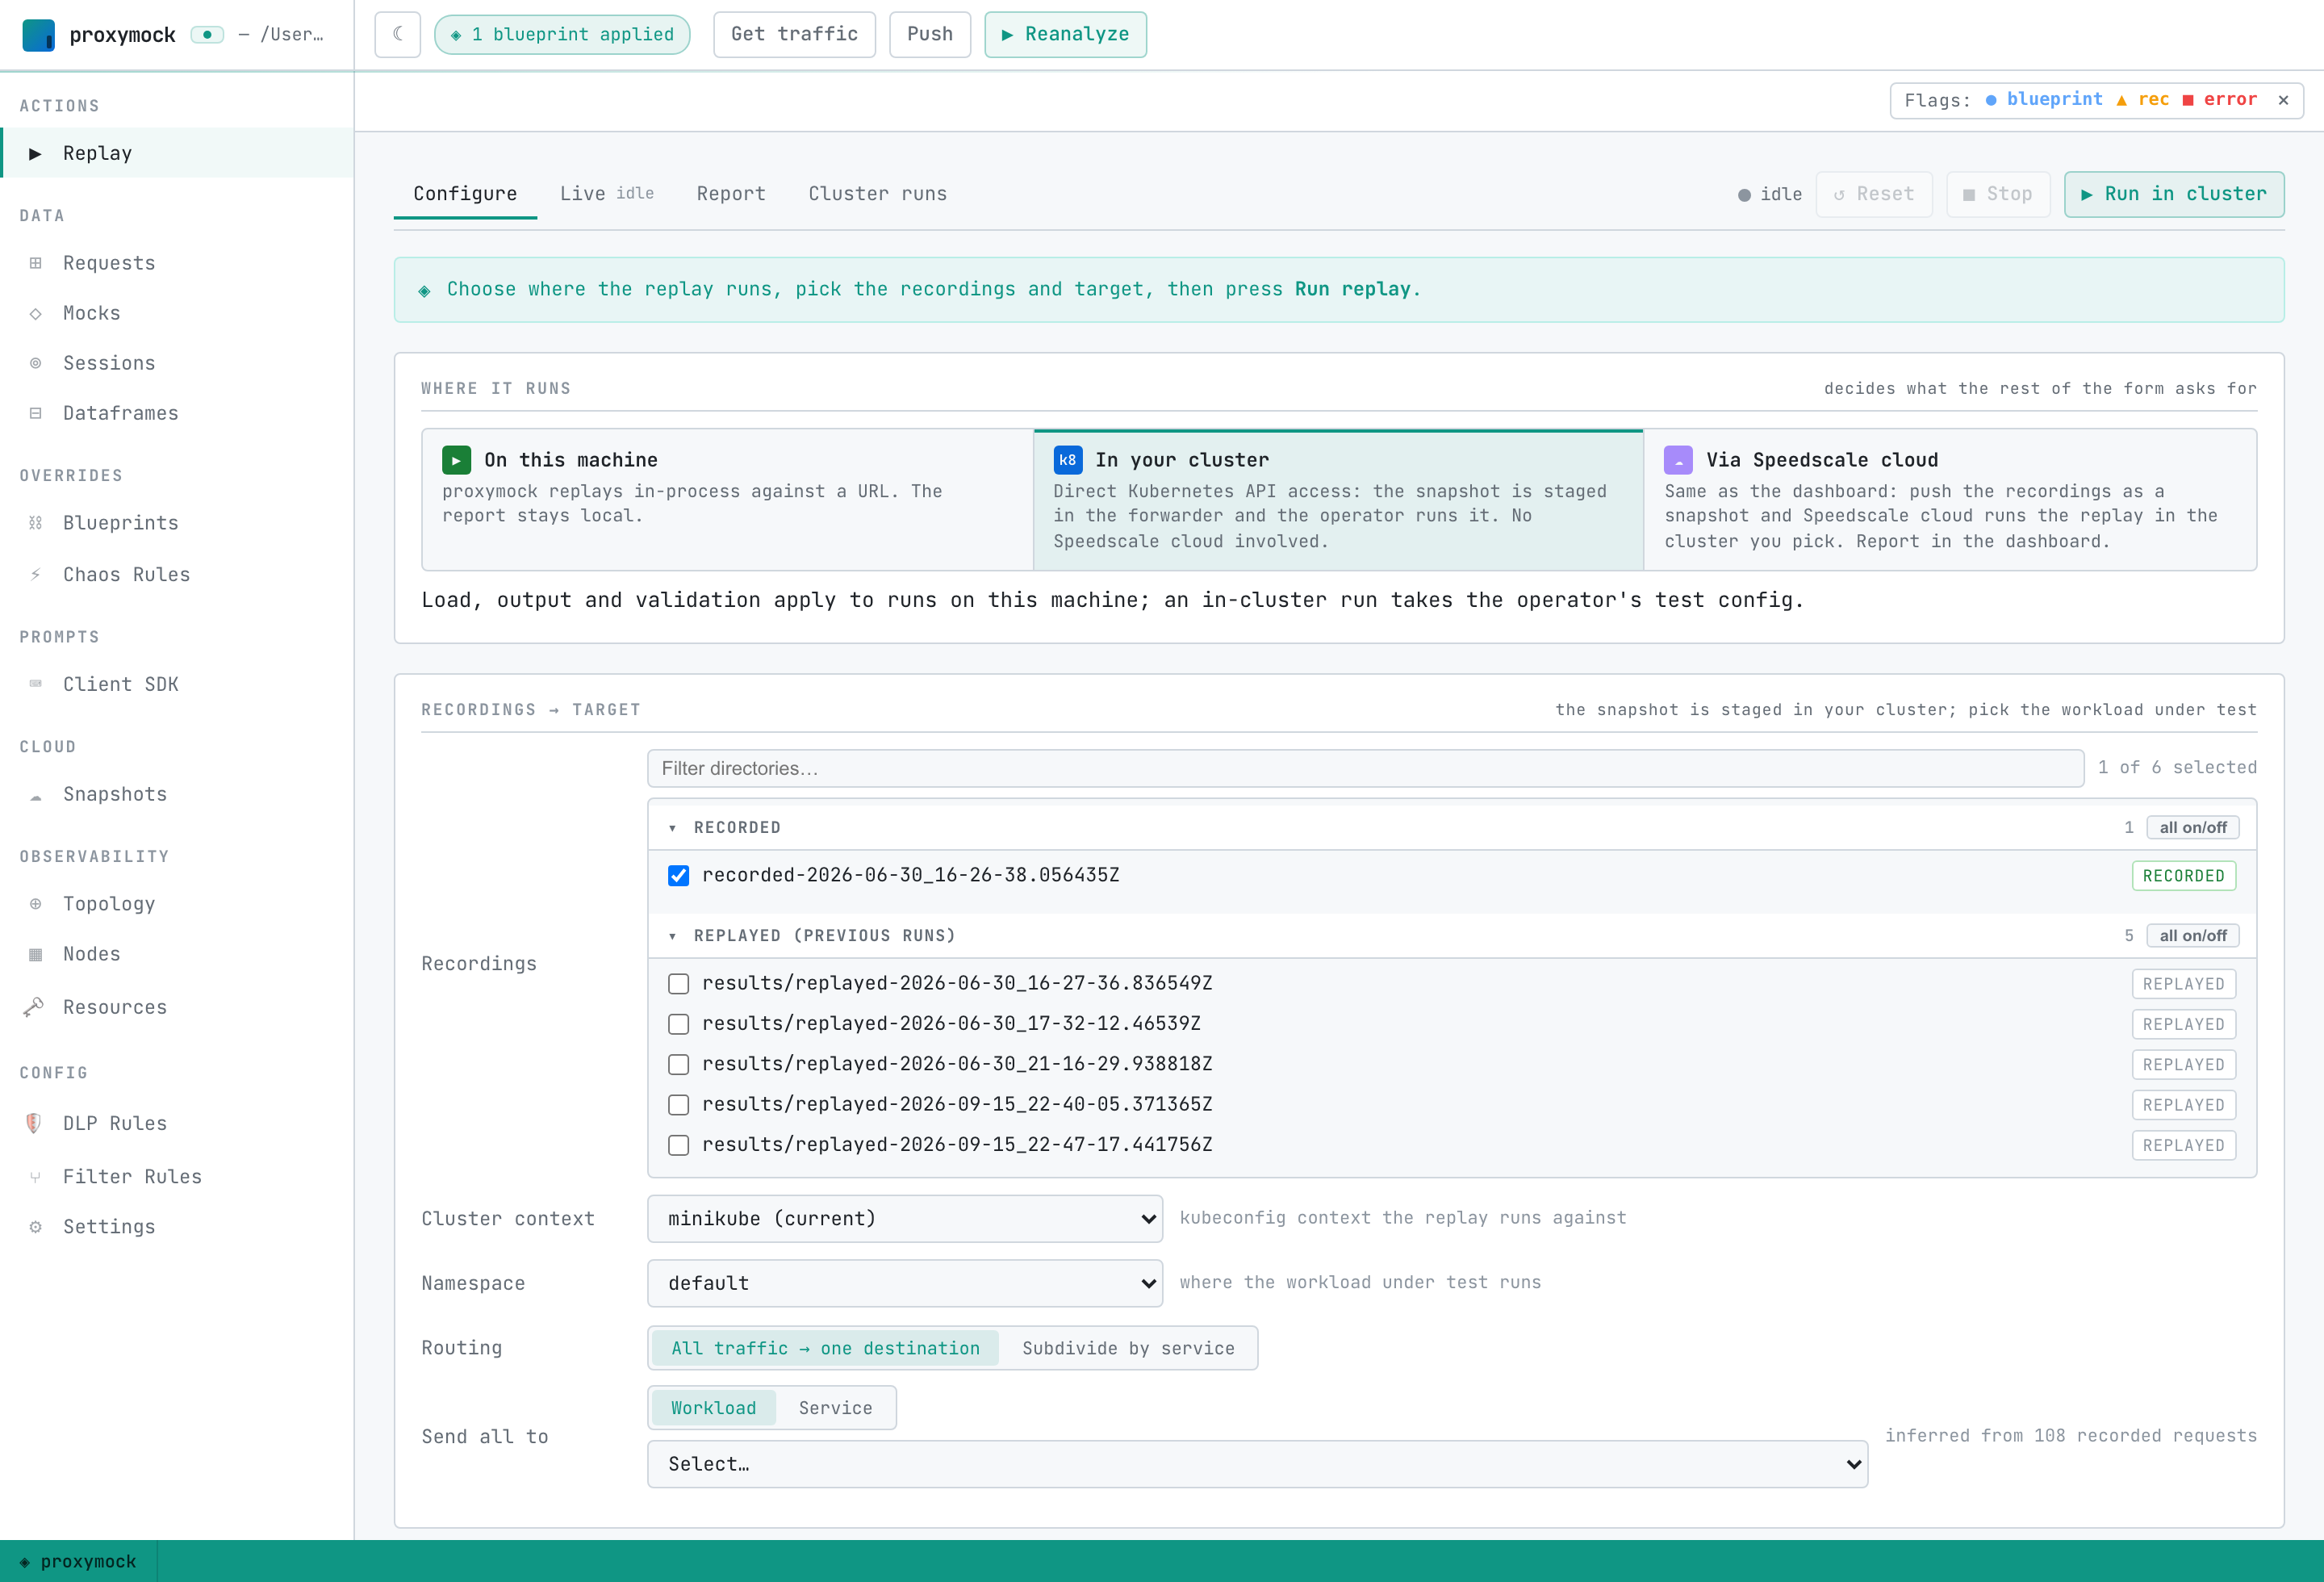
Prerequisites: a kubeconfig context for the cluster and the Speedscale operator installed in it. No login.
- Start proxymock web with the context you want, for example
proxymock web --kube-context minikube. - Pick In your cluster, then the cluster context and the namespace your workload runs in.
- Set the destination to a Workload or Service. A plain URL is resolved inside the generator pod, where your laptop's
localhostdoes not exist. - Every recorded dependency is mocked by default, so the workload answers from the recording instead of reaching the real thing. To mock only some, or to let the workload reach its real dependencies, open Options and change Mock dependencies.
- Press Run in cluster.
The same run from the CLI:
proxymock cluster replay start --in ./proxymock -n my-namespace --workload my-service --wait -o json
The result reports snapshotSource. local means the snapshot was staged in the cluster. cloud means staging failed and proxymock fell back to pushing it, which needs a login. Watch and read a run with proxymock cluster replay status and proxymock cluster replay logs; see Work a Kubernetes Cluster from the CLI.
Via Speedscale cloud
This is the same replay the Speedscale dashboard starts. The recordings are pushed as a snapshot, Speedscale cloud starts the replay in the cluster you choose, and the report lands in the dashboard where it can be shared, compared, and kept.
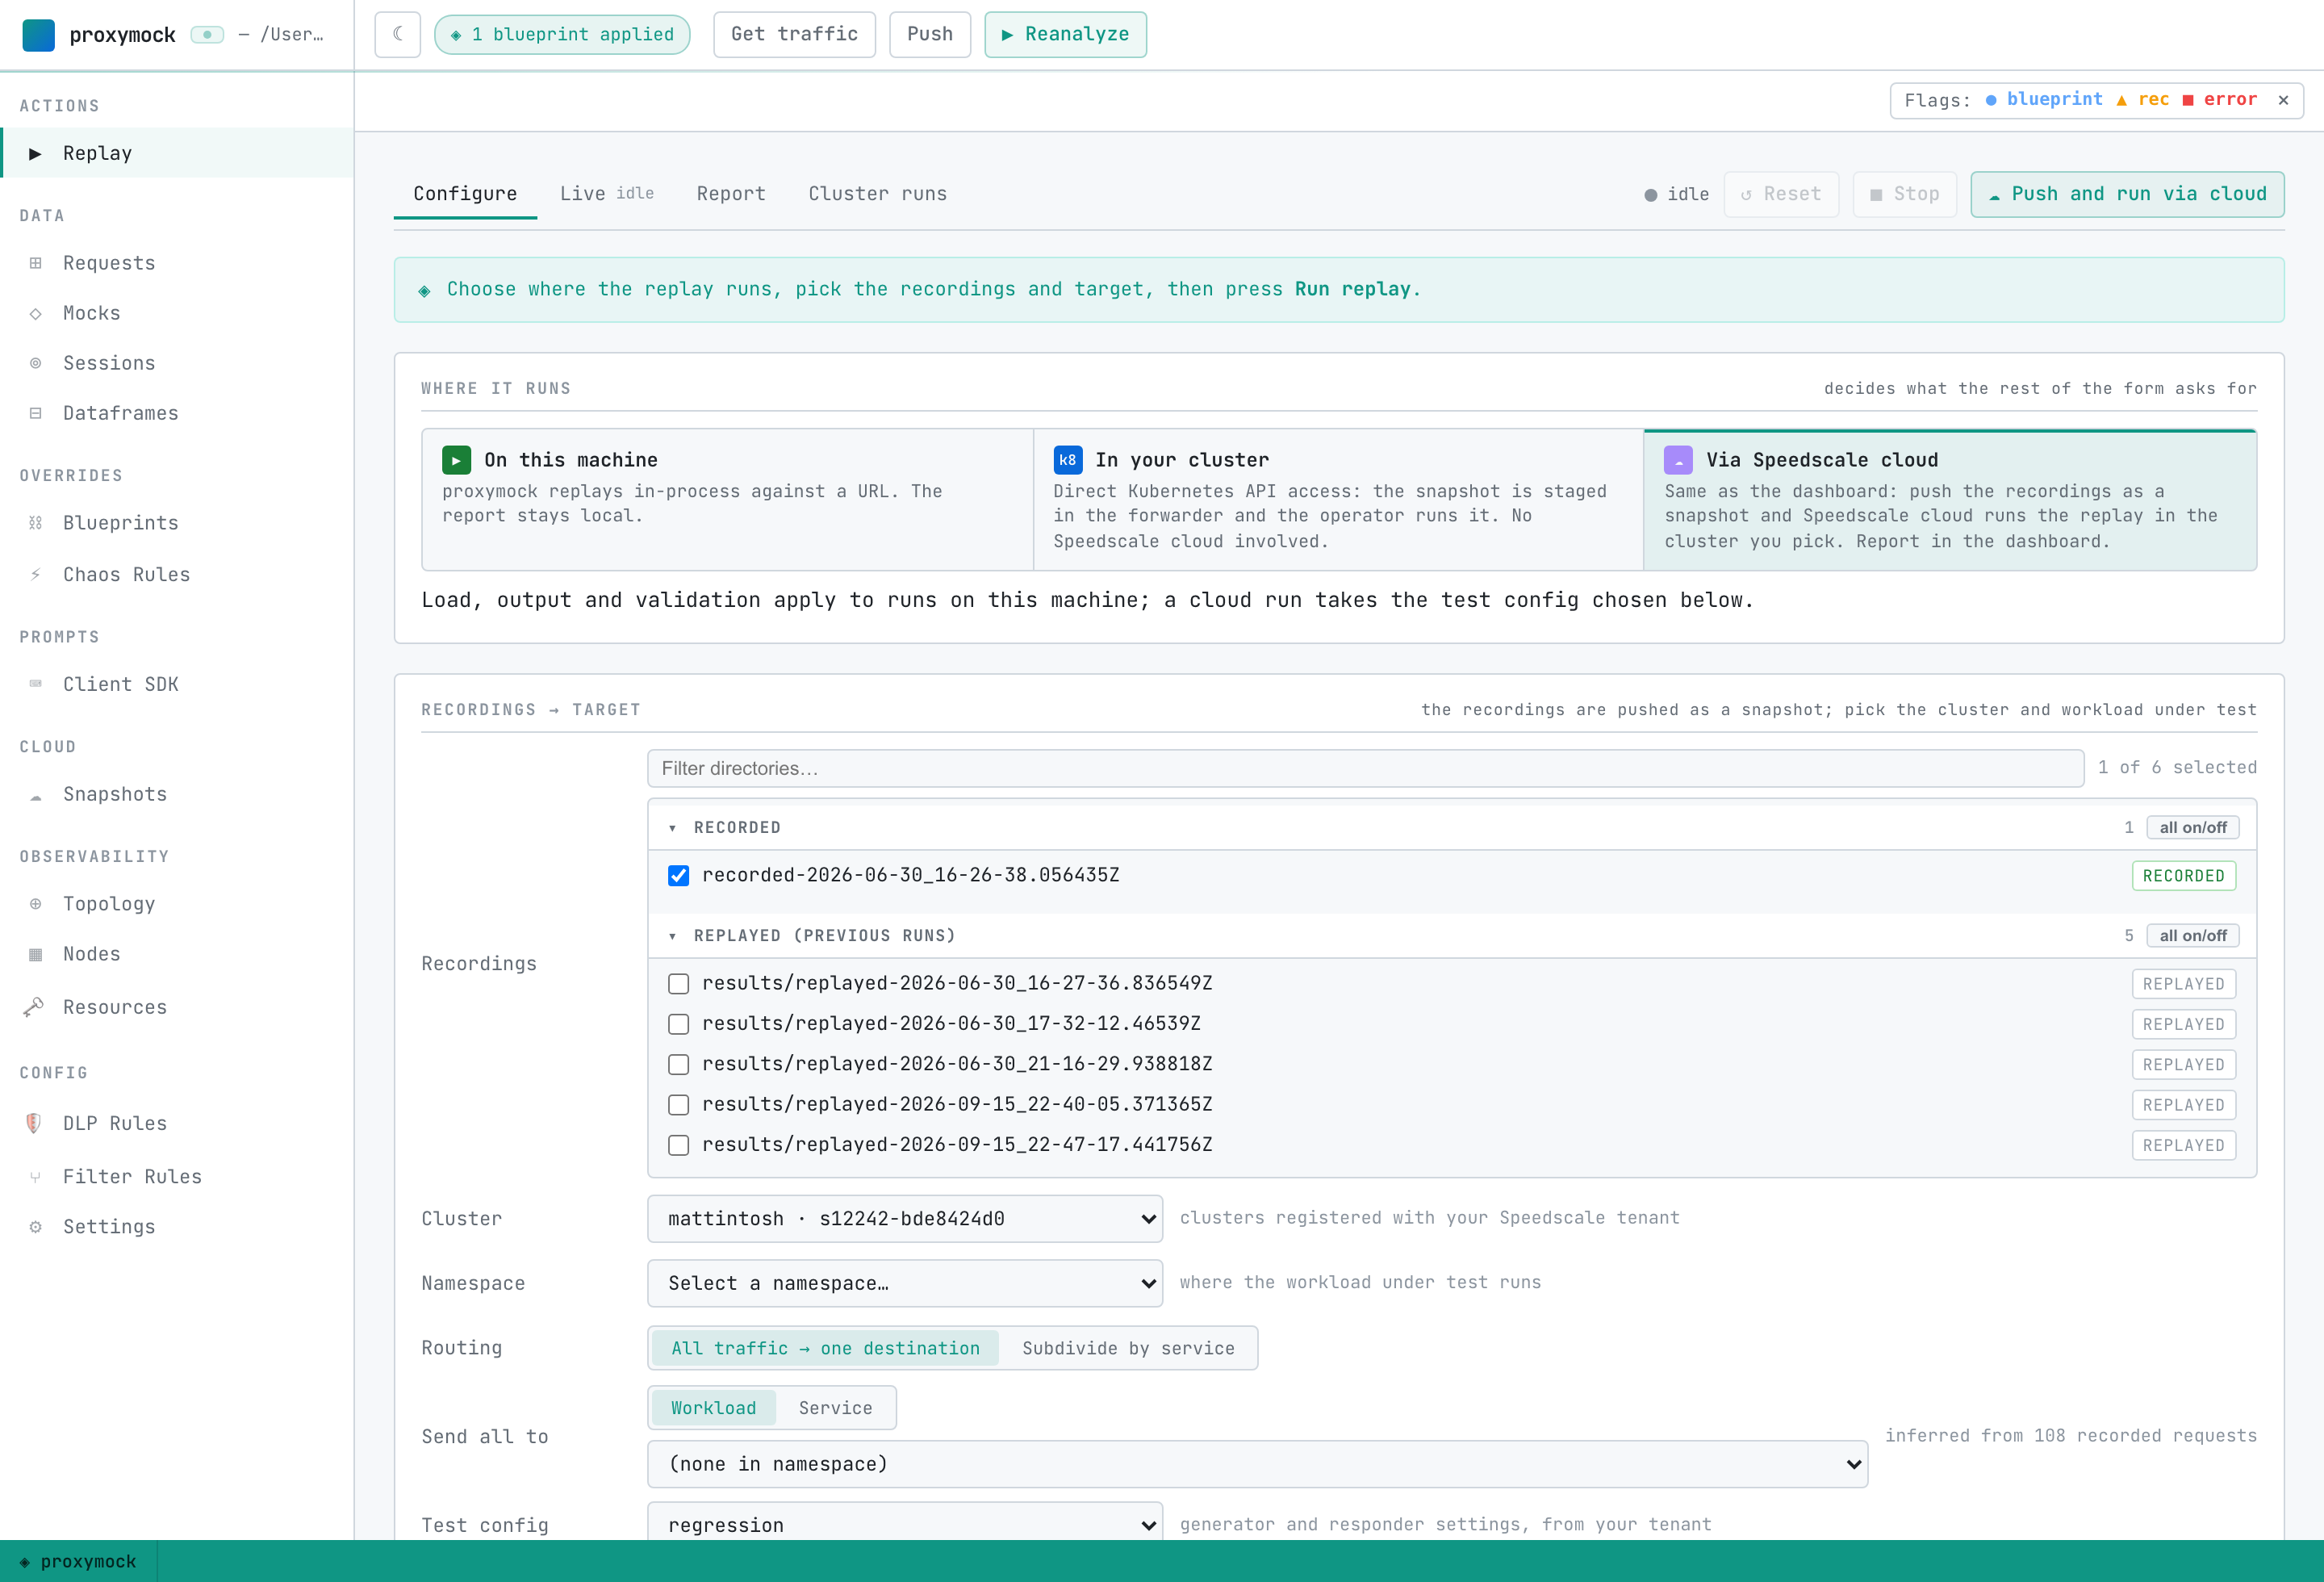
Prerequisites: a Speedscale cloud login (proxymock init) and a cluster registered with your tenant, which means the operator there is connected to Speedscale cloud.
- Pick Via Speedscale cloud.
- Choose the Cluster, the Namespace, and the workload under test. These lists come from your tenant, not your kubeconfig, so you do not need cluster credentials on this machine.
- Choose a Test config if you want something other than
regression. - Press Push and run via cloud.
The same run from the CLI:
proxymock cloud replay --in ./proxymock --cluster my-cluster -n my-namespace --workload my-service --wait
Add --dry-run to print what would be pushed and started without doing either. --wait polls until the report reaches a terminal status and prints its dashboard link. Like the in-cluster path, a workload replay mocks every recorded dependency unless you narrow it with --mock or turn it off with --no-mocks. This is the proxymock equivalent of replaying with speedctl.
From an AI agent
The MCP server exposes all three paths, so an assistant can pick one:
| Path | Tool and action |
|---|---|
| On this machine | replay_traffic, with mock_server_start for dependencies |
| In your cluster | the cluster tool, action replay-start, then replay-status and replay-logs |
| Via Speedscale cloud | the cloud_replay tool: clusters, namespaces, workloads, start, status |
replay-start takes snapshot_source. The default, auto, stages the snapshot in the cluster and falls back to a cloud push. Use local to refuse the fallback, so a run that cannot stage in the cluster fails instead of sending recordings to Speedscale cloud. See the MCP tools reference.