Pricing FAQ
Speedscale's pricing is based on the amount of data ingested, measured in gigabytes (GB). Below are answers to common questions about how billing works, how to avoid surprises, and how to optimize your usage.
💡 How does Speedscale’s usage-based pricing work?
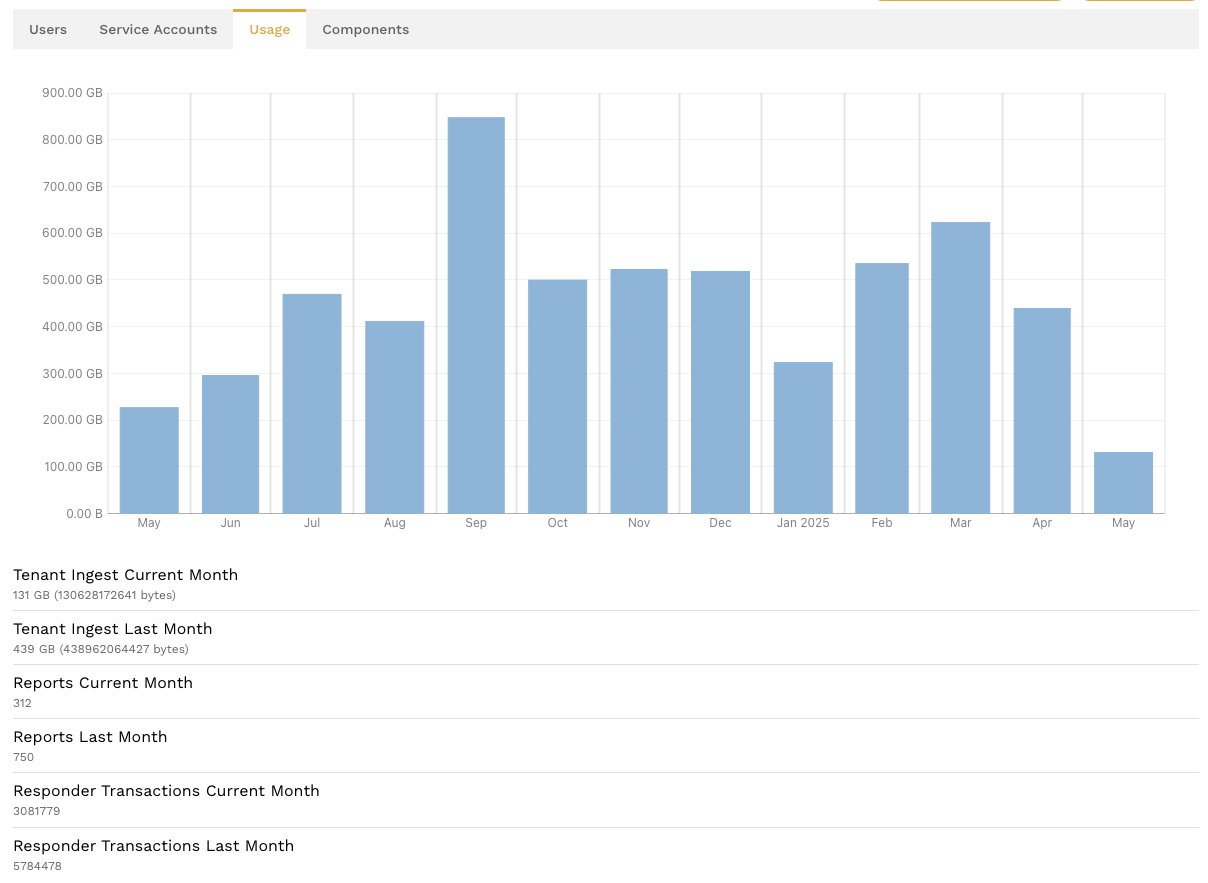
Speedscale charges based on the total amount of data ingested to Speedscale Cloud, measured in GB per month. You can view your usage within Usage section of the Speedscale UI.
🔍 What counts toward my monthly data usage?
Data usage includes:
- Request and response payloads
- Headers and metadata
- Enriched context added during transformation
- Internal Speedscale replay orchestration traffic (if enabled)
The follow two metrics on the usage dashboard capture these items:
- Tenant Ingest Current Month: - How much you've used in the current billing period (so far)
- Tenant Ingest Last Month: - How much you used in the last billing period
Speedscale provides various usage metrics for visibility, but only data ingest is relevant for pricing.
⚠️ What are some common causes of unexpected overages?
- High-traffic services: If you capture high-throughput services without filtering, usage can spike quickly.
- Background or noisy traffic: Health checks, polling endpoints, or verbose internal service calls can add significant overhead.
- Unfiltered ingress: Without filters, all incoming/outgoing traffic is captured by default, including irrelevant or duplicate traffic.
- Replays and load tests: Running tests with high concurrency can multiply the amount of data ingested. Use Low Data Mode when you run performance tests.
💰 How can I control or limit ingest costs?
Here are several strategies to avoid surprises:
✅ 1. Use traffic filters
Apply traffic filters to capture only the endpoints, headers, or service patterns that matter. This reduces noise and focuses ingest on useful interactions. Common noisy traffic includes health checks, monitoring systems, and database keepalives. The default standard filter set excludes common monitoring traffic such as Datadog and New Relic.
🛑 2. Turn off capture during idle periods
Use the eBPF capture annotation to stop collecting from a workload outside business hours or test windows:
kubectl annotate deployment my-app -n my-namespace \
  capture.speedscale.com/enabled="false" --overwrite
Set the value back to "true" when the recording window begins. Annotation-based targeting requires ebpf.enabled: true in the Operator Helm values.
⚙️ 3. Capture only during recording windows
Use your deployment automation or a CronJob to enable eBPF capture only during performance tests, CI/CD workflows, or planned recording windows. See eBPF annotation-based capture.
For legacy sidecar capture, the built-in scheduler can start and stop recording windows when remote control is enabled. The scheduler does not change eBPF capture targets or annotations. See schedules for the available actions.
🎯 5. Scope deployments
Use eBPF capture targets to select only the namespaces and workloads with active testing or observability needs. Avoid cluster-wide capture unless it is required.
🧪 Can I test while limiting ingest costs?
Yes. Speedscale offers the ability to:
- Record once, replay many times: Replays of previously recorded traffic do not count as new ingest, although the test artifacts will cause some minor ingest.
- Use local proxymock recordings: Capture and replay traffic locally during development without ingesting data into Speedscale Cloud. Limits apply, but this is a good option for quick local regressions.
You can see current and historical usage by navigating to Settings > Usage in the Speedscale UI. Detailed breakdowns by service and namespace are available for the last seven days to help identify cost centers. Click on the main navigation -> Services for a list of services that have reported traffic in the last seven days.

Click on a service to see more detail. In the traffic viewer you can adjust traffic filters to isolate high volume requests. For instance, you might want to filter for the /heartbeat endpoint to see if that is the source of your traffic. The service map will show total transaction counts by service, with the current filters applied.
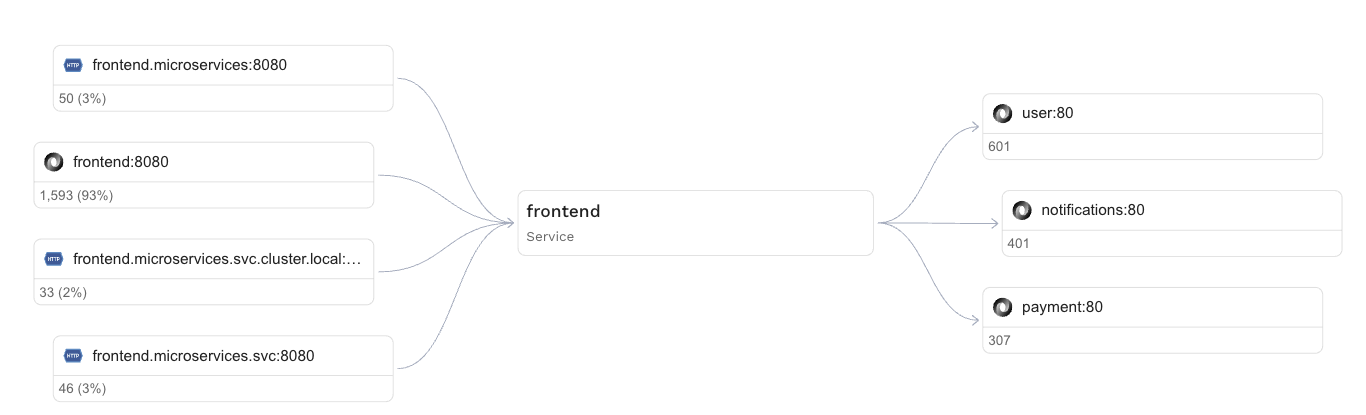
The number in each box is the number of transactions for the particular inbound or outbound service. Calculating the exact volume in bytes of a particular set of traffic requires creating a snapshot. Press the Save button to create a snapshot.
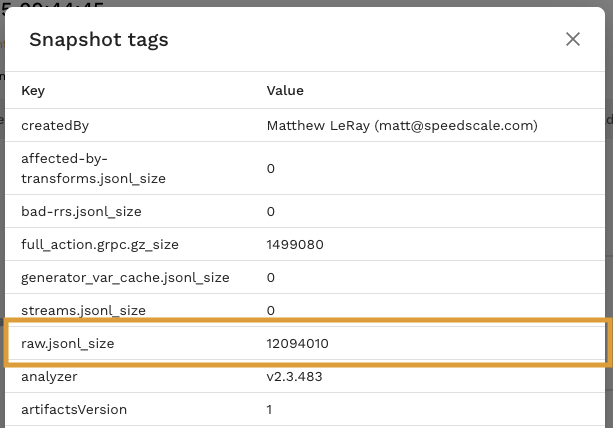
Select the three dot menu in the top right of the snapshot summary and select "View tags." The raw.jsonl_size contains the amount of ingest in bytes used by this specific traffic set.
🚨 Can I set usage limits?
Speedscale now supports setting a monthly usage limit to help you control ingest costs proactively. When your usage exceeds the threshold you set, Speedscale will automatically send an email alert. Here’s how it works:
- Monthly reset: The usage counter resets on the first day of each month.
- Single alert recipient: Only one email address can be entered for usage alerts. The email must match the domain of the admin user who sets the threshold.
- One threshold per tenant: Each tenant can have only one usage alert and one threshold level at a time. You can update or remove the threshold at any time using the same process.
- Alert delivery: When your monthly usage exceeds the set threshold, an email is sent to the configured address.
You can set or modify your usage threshold in two ways:
Using the Speedscale Dashboard
Go to Settings > Usage and scroll down to set your monthly usage threshold and alert email.
Using the Command Line (speedctl)
You can also configure the usage alert via the speedctl CLI:
speedctl config set-usage-threshold
🧠 Are there best practices for managing ingest-based pricing?
Absolutely. Here are a few customer-tested techniques:
| Practice | Description |
|---|---|
| Target workloads selectively | Use namespace and pod selectors in the eBPF capture configuration |
| Add smart filters | Only capture what’s needed for test coverage or debugging |
| Use test scheduling | Enable capture only during CI/CD jobs or planned recording windows |
| Monitor billing data weekly | Watch for anomalous spikes before they turn into bill surprises |
| Reuse traffic recordings | Reduce ingest by replaying stored traffic scenarios instead of re-recording |
📞 Still have questions?
If you’re unsure about your usage or need help tuning your deployment for cost efficiency, contact Speedscale Support, contact us on the Speedscale Community or reach out to your account manager.