Read the results
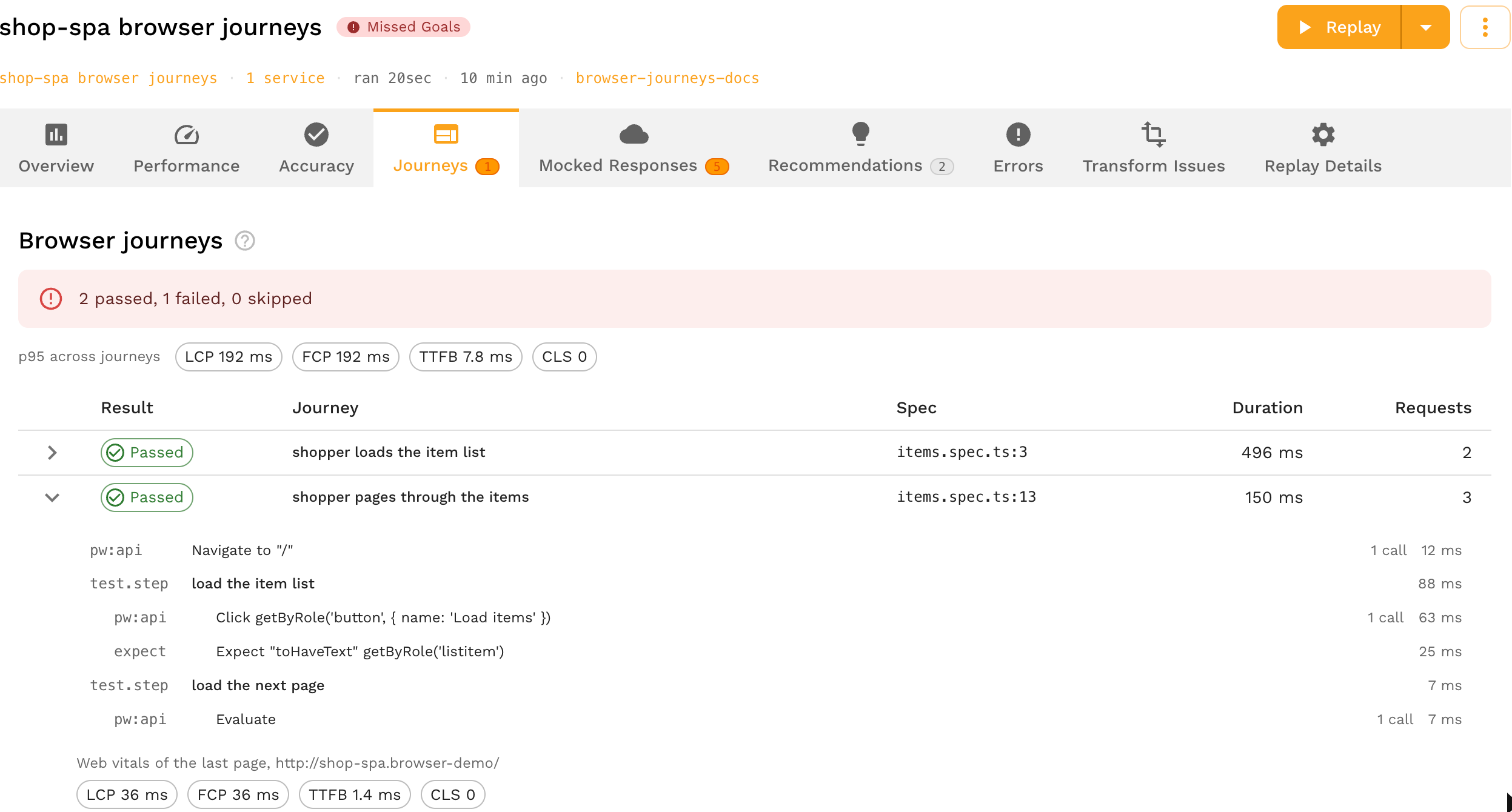
A replay that ran journeys gets a Journeys tab in its report. The tab's badge counts the journeys that failed.
Journeys
The top of the tab counts the journeys that passed, failed and were skipped. Each row is one journey:
| Column | Shows |
|---|---|
| Result | Passed, Failed or Skipped, as Playwright reported it. A journey that ran out of time says Timed out. |
| Journey | The test's title, with the first line of its error when it failed. |
| Spec | The spec file and line the test starts on. |
| Duration | How long the journey ran. |
| Requests | How many requests the browser made during the journey. |
Steps and the calls behind them
Expand a journey to see its steps in the order they ran, nested as Playwright reported them. Each step shows its category (pw:api for a Playwright action, test.step for a step you named, expect for an assertion), its title, its duration and how many calls it made. A step that failed shows its error.
Each call the browser made is credited to the step that caused it; see Name the steps. Under the step that made them, the tab names:
- Calls the recording could not answer. With mocks on, these went to the real host or failed. Either way the journey did not run on recorded data, so record them or check why the frontend made them.
- Calls the real API answered differently from the recording. With mocks off, these are the calls whose real response differs from the recorded one, with what differed in brackets, such as
(Status Code)or(Body JSON).
A call that no step claims, such as one made before the first action, is listed in a box under the steps instead.
Web vitals
Under the steps, the tab shows the web vitals of the last page the journey was on:
| Vital | Measures |
|---|---|
| LCP | Largest Contentful Paint: when the largest image or text block showed. |
| FCP | First Contentful Paint: when the first text or image showed. |
| TTFB | Time to First Byte: how long the page's own request took to start answering. |
| CLS | Cumulative Layout Shift: how much the page's content moved while it loaded. |
Above the table, the tab shows each vital's p95 across all journeys.
A failed journey's files
Playwright keeps a screenshot, a trace and an error context for each failed journey, and the expanded journey shows them. The files are not redacted: they show what the page showed.
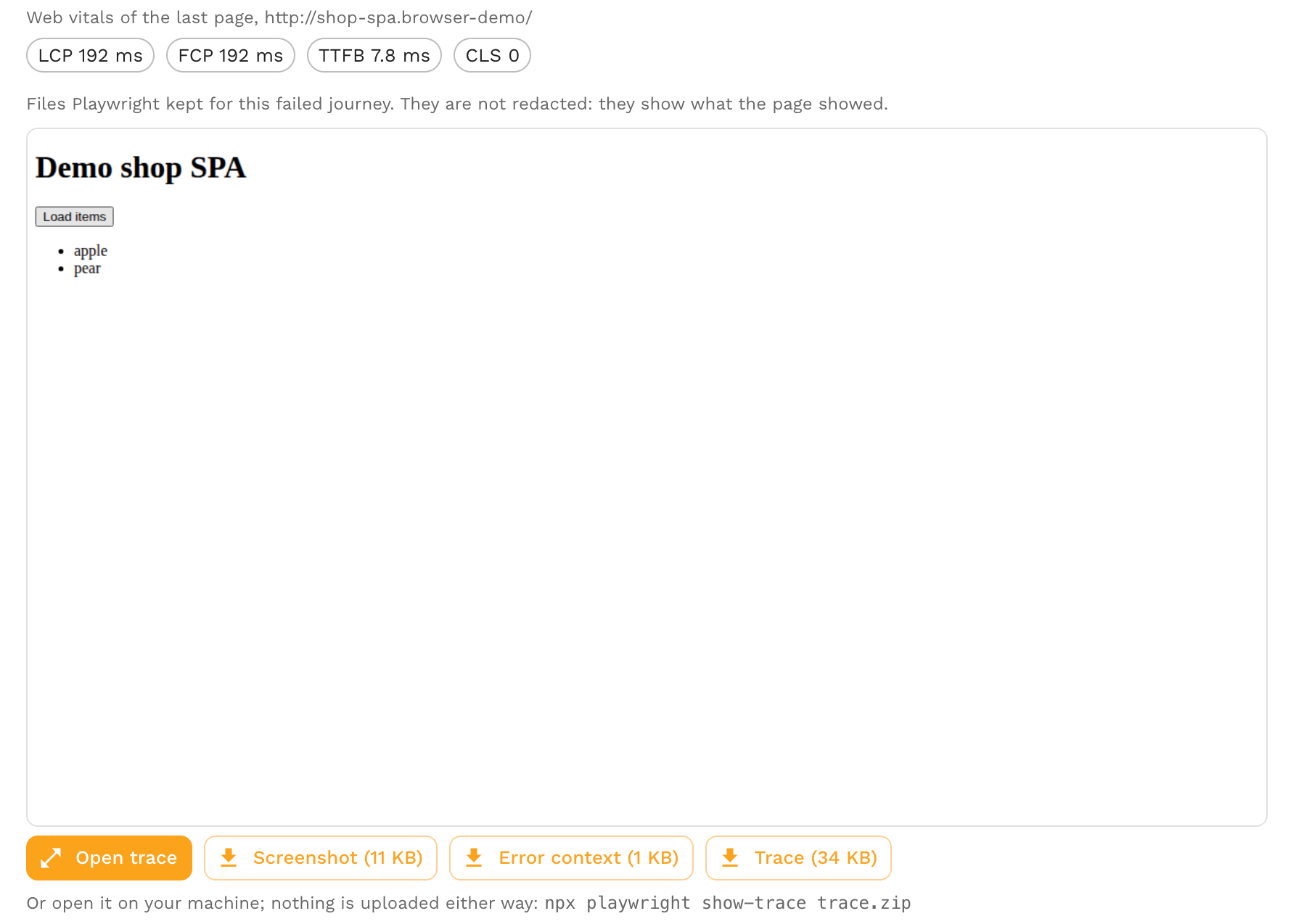
- Screenshot. The page as it was when the journey failed, shown under the steps.
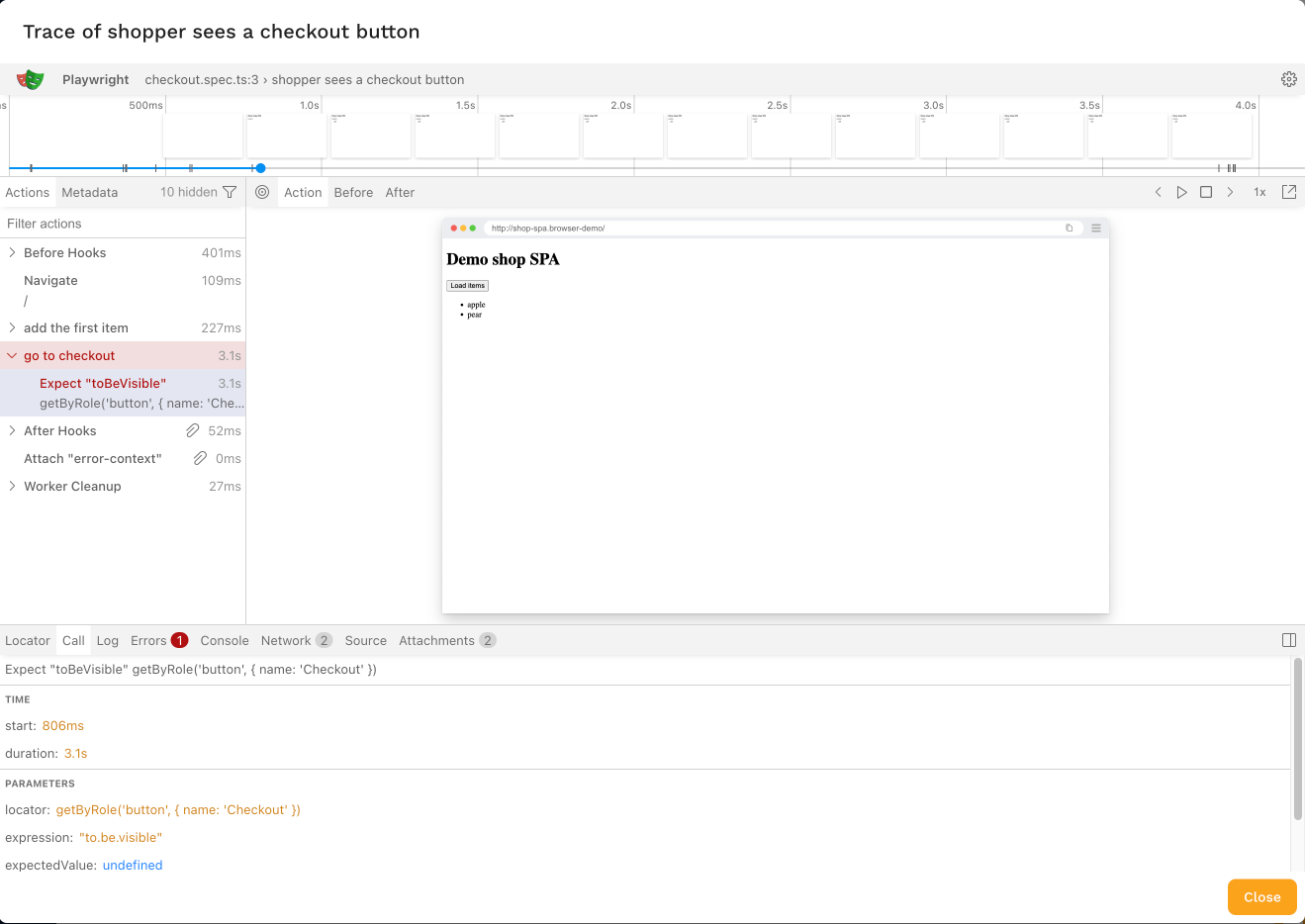
- Open trace. Opens the trace in Playwright's trace viewer inside the dashboard. The viewer replays the journey action by action, with a snapshot of the page before and after each one, the console, the network calls and the error. The trace is read in your browser and is not sent anywhere else.
- Downloads. Each file also downloads under its own name, for example to open a trace on your machine:
npx playwright show-trace trace.zip
A cloud-free cluster replay keeps these files in the cluster instead, and proxymock cluster replay start --wait downloads them; see Run journeys in a cluster.
Calls in the rest of the report
Every request the browser made is traffic in the report, tagged with its journey and step, so the report's other tabs work on it. On the Errors tab, each call that failed shows as a Browser Call assertion. Mocks and real APIs explains which calls pass.
Goals
A replay passes or fails on its goals, like any other replay. These metrics are available for goals on a journey replay:
| Metric | Value |
|---|---|
browserJourneyPassPct | The percentage of journeys that passed, skipped journeys left out. |
browserJourneyPassCount, browserJourneyFailCount, browserJourneyTotalCount | The number of journeys that passed, failed and ran. |
browserLcpP50, browserLcpP95, browserLcpMax | Largest Contentful Paint across journeys, in milliseconds. |
browserFcpP50, browserFcpP95, browserFcpMax | First Contentful Paint across journeys, in milliseconds. |
browserTtfbP50, browserTtfbP95, browserTtfbMax | Time to First Byte across journeys, in milliseconds. |
browserClsP50, browserClsP95, browserClsMax | Cumulative Layout Shift across journeys. |
For example, to fail the replay when any journey fails or when p95 LCP is over 2.5 seconds:
"rules": [
  { "metricName": "browserJourneyPassPct", "type": "TOO_LOW", "value": 100, "action": "ALERT" },
  { "metricName": "browserLcpP95", "type": "TOO_HIGH", "value": 2500, "action": "ALERT" }
]
See Goals for how goals work.