Run journeys in a cluster
In a cluster, the Speedscale operator runs your journeys in a generator pod against a frontend deployed in Kubernetes, or any frontend the cluster can reach. A responder runs beside the browser in the same pod and answers the frontend's API calls from the recording, so the frontend's API tier does not have to be deployed.
Before you start
- The Speedscale operator installed in the cluster, on a release that includes browser journeys.
- The frontend's URL as the cluster sees it, such as
http://shop-frontend.web:80. - Journeys that follow what a replay expects.
The generator pod for a journey replay uses the generator-browser image, which adds Node.js, Playwright and Chromium to the generator. It is larger than the usual generator image, and the pod gets a 1 GiB memory-backed /dev/shm, which Chromium needs.
From the command line
proxymock cluster replay start --browser packs a folder of journeys with the recording and runs them in the cluster:
proxymock cluster replay start --in <recording> --browser ./journeys \
  --target http://shop-frontend.web:80 --wait
--target is the frontend's URL. What happens by default:
- The snapshot stays in the cluster. The recording and journeys are staged in the cluster's forwarder, with no Speedscale cloud round trip. Add
--snapshot-source cloudto push them to Speedscale cloud with the snapshot and read the run as a report there. - The frontend's API calls are mocked. The responder beside the browser answers calls to the hosts the recording knows from the recording, and reaches every other host directly. Add
--no-mocksto send every call to the real APIs instead; see Mocks and real APIs. - Only the generator runs. The replay defaults to
generator-onlymode, because the responder it needs runs inside the generator pod. - The test config is the built-in one with journeys turned on. Pass
--test-configto use your own; its other browser settings and goals apply.
With --wait, the command follows the replay to the end. A cloud-free run then prints its result, exits nonzero if it missed its goals, and downloads each failed journey's screenshot, trace and error context:
screenshots and traces of failed journeys, saved to browser-artifacts/<report id>:
  shopper sees a checkout button (checkout.spec.ts:3) screenshot: browser-artifacts/<report id>/shopper-sees-a-checkout-button/test-failed-1.png
  shopper sees a checkout button (checkout.spec.ts:3) trace: browser-artifacts/<report id>/shopper-sees-a-checkout-button/trace.zip
open a trace with: npx playwright show-trace browser-artifacts/<report id>/shopper-sees-a-checkout-button/trace.zip
A run with --snapshot-source cloud keeps the same files with its report instead.
Run a replay in your cluster covers the rest of proxymock cluster replay: choosing a cluster and namespace, status, and stop.
From the dashboard
The dashboard starts a journey replay from a snapshot that carries journeys. Store journeys with a snapshot when you push it:
proxymock cloud push snapshot --in <recording> --browser ./journeys
A proxymock cluster replay start --browser --snapshot-source cloud run stores them the same way.
Then open the replay launcher for that snapshot at /replay-launcher?snapshotId=<snapshot id>:
- Under Start from, pick Browser journeys. The row appears only when the snapshot carries journeys, and names its specs.
- Under System under test, enter the Frontend URL, the frontend's URL as the cluster sees it.
- Pick the cluster under Where it runs.
- Leave Answer the frontend's API calls from the recording on to mock the frontend's APIs, or turn it off to send every call to the real APIs and compare the answers with the recording.
- Check the goals under Test settings. The template starts with Browser journeys passing ≥ 100%.
- Select Start. When the replay finishes, open its report's Journeys tab; see Read the results.
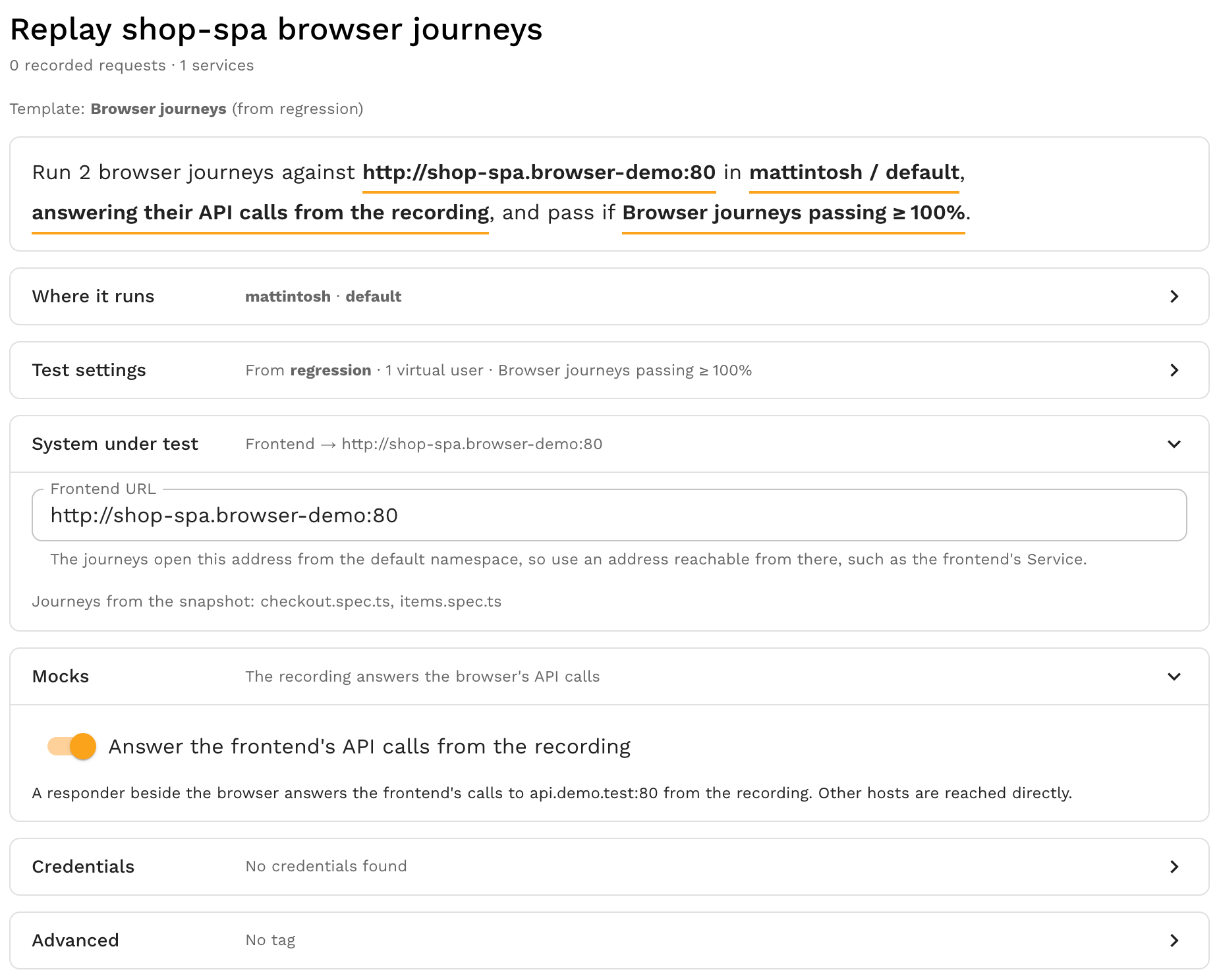
The run panel beside the launcher shows the proxymock cluster replay start --browser command for the same run, for a replay from your machine's copy of the journeys and recording.
In a test config
Any replay runs journeys when its test config turns them on. The command line and the launcher set this for you. To run journeys from a CI pipeline or your own config, set generator.browser:
{
  "generator": {
    "browser": {
      "enabled": true,
      "responderProxy": true,
      "workers": 2,
      "journeyTimeout": "60s",
      "blockPatterns": ["**/www.googletagmanager.com/**"]
    }
  },
  "cluster": {
    "replayMode": "generator-only"
  },
  "rules": [
    { "metricName": "browserJourneyPassPct", "type": "TOO_LOW", "value": 100, "action": "ALERT" },
    { "metricName": "browserLcpP95", "type": "TOO_HIGH", "value": 2500, "action": "ALERT" }
  ]
}
The journeys come from the snapshot. To carry them in the config itself, put them in journeyFiles. Every setting is in the browser test config reference.