In-Cluster (Web)
Use proxymock web to work directly against your Kubernetes cluster. You can:
- Enable eBPF capture on a workload to record real in-cluster traffic
- Run an in-cluster replay of your local recordings (“Run in cluster”) and stream results live
This path is best when you want realistic in-environment behavior or to validate changes inside the cluster.
Prerequisites
- Kubernetes cluster access (
kubectlworking, correct context) - Authorized (if you plan to run in-cluster replay):
proxymock init(browser sign-in)
1) Install the proxymock CLI (if not installed)
Install proxymock locally — this gives you both the CLI and proxymock web.
- macOS
- Linux
- Other / Detailed
Install with Homebrew:
brew install speedscale/tap/proxymock
Run the install script:
sh -c "$(curl -Lfs https://downloads.speedscale.com/proxymock/install-proxymock)"
After install, initialize once (browser sign-in by default):
proxymock init
2) Install the Speedscale Operator (if not installed)
If your cluster doesn’t have the Speedscale Operator and Forwarder yet, install them first. Full instructions live here: /getting-started/installation/install/kubernetes-operator/
Quick Helm example:
helm repo add speedscale https://speedscale.github.io/operator-helm/
helm repo update
helm install speedscale-operator speedscale/speedscale-operator \
  -n speedscale \
  --create-namespace \
  --set apiKey=<YOUR-SPEEDSCALE-API-KEY> \
  --set clusterName=<YOUR-CLUSTER-NAME>
Once installed and reachable, proxymock web will detect the Forwarder and enable Observability and live features via Kubernetes port-forwarding.
To use proxymock web with your cluster, you must have Kubernetes RBAC permissions that allow port forwarding.
If you cannot port-forward (e.g., on restricted clusters), use the cloud-based replay feature in Speedscale instead.
3) Start proxymock web and connect to your cluster
proxymock web
# Open the printed http://127.0.0.1:XXXX URL
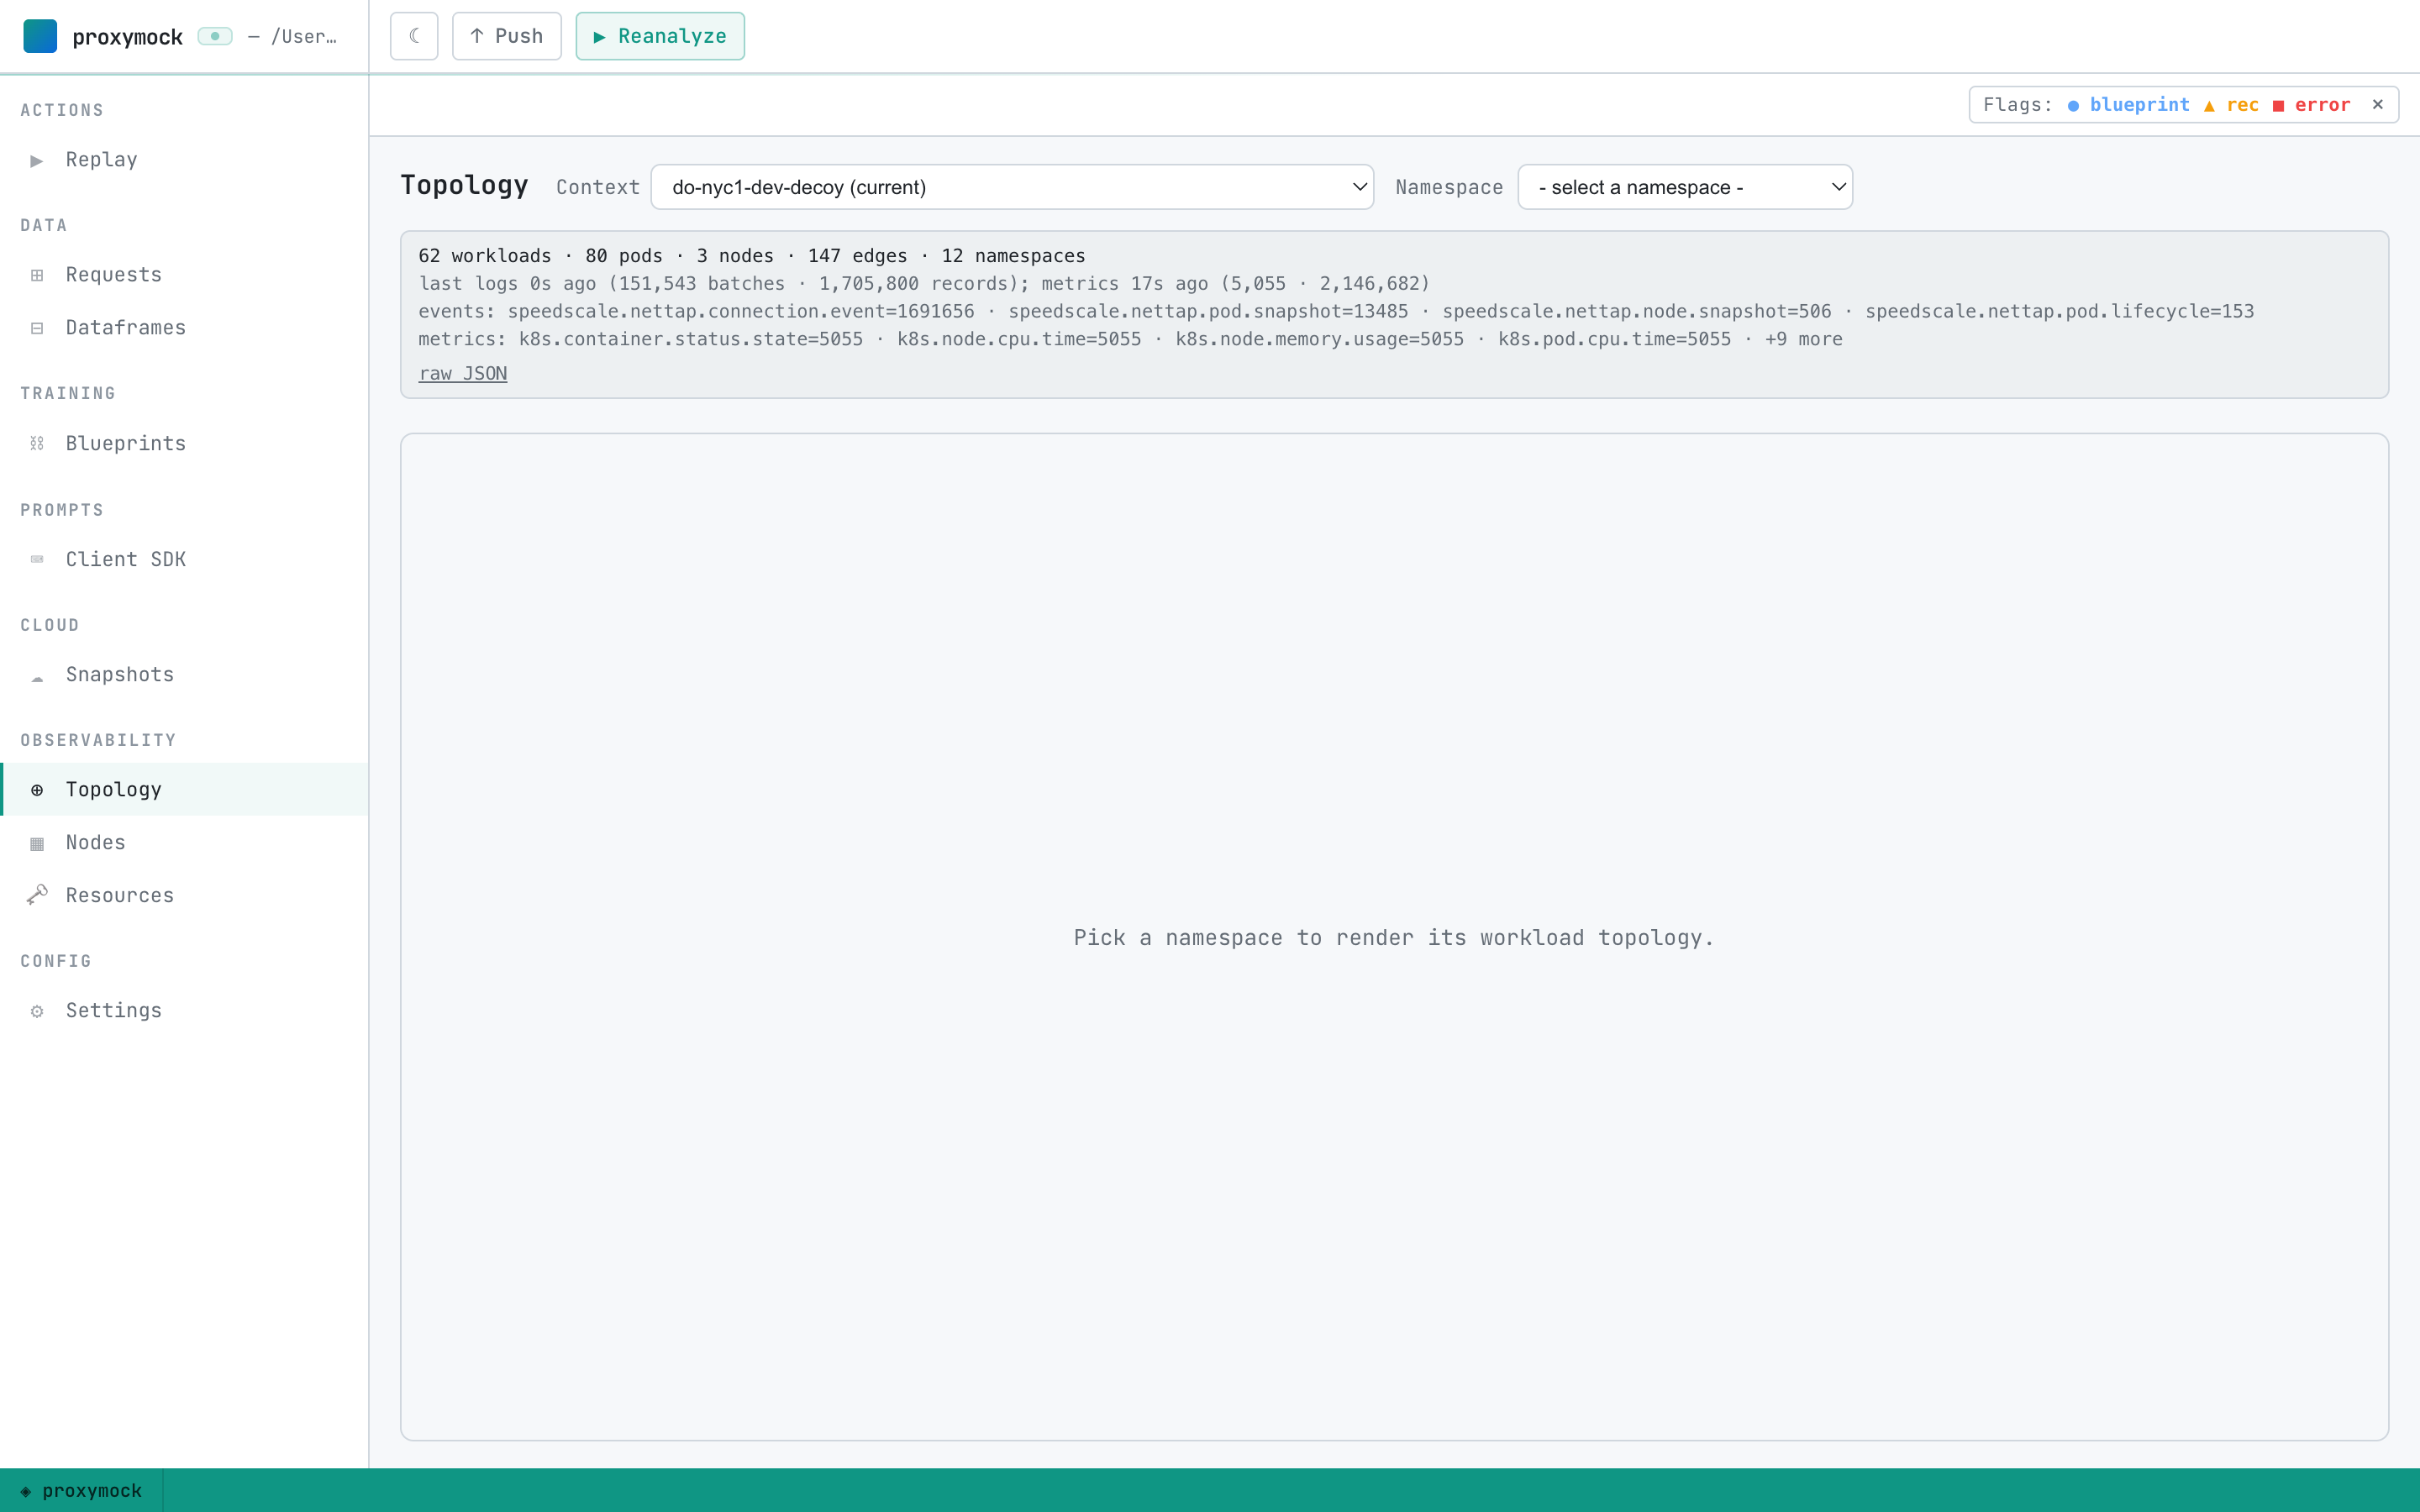
- Open Observability → Topology.
- If not connected, use the Retry control (proxymock web auto port-forwards to the Forwarder when possible).
- Optionally switch kube context from the toolbar.
4) Record traffic from a workload (eBPF capture)
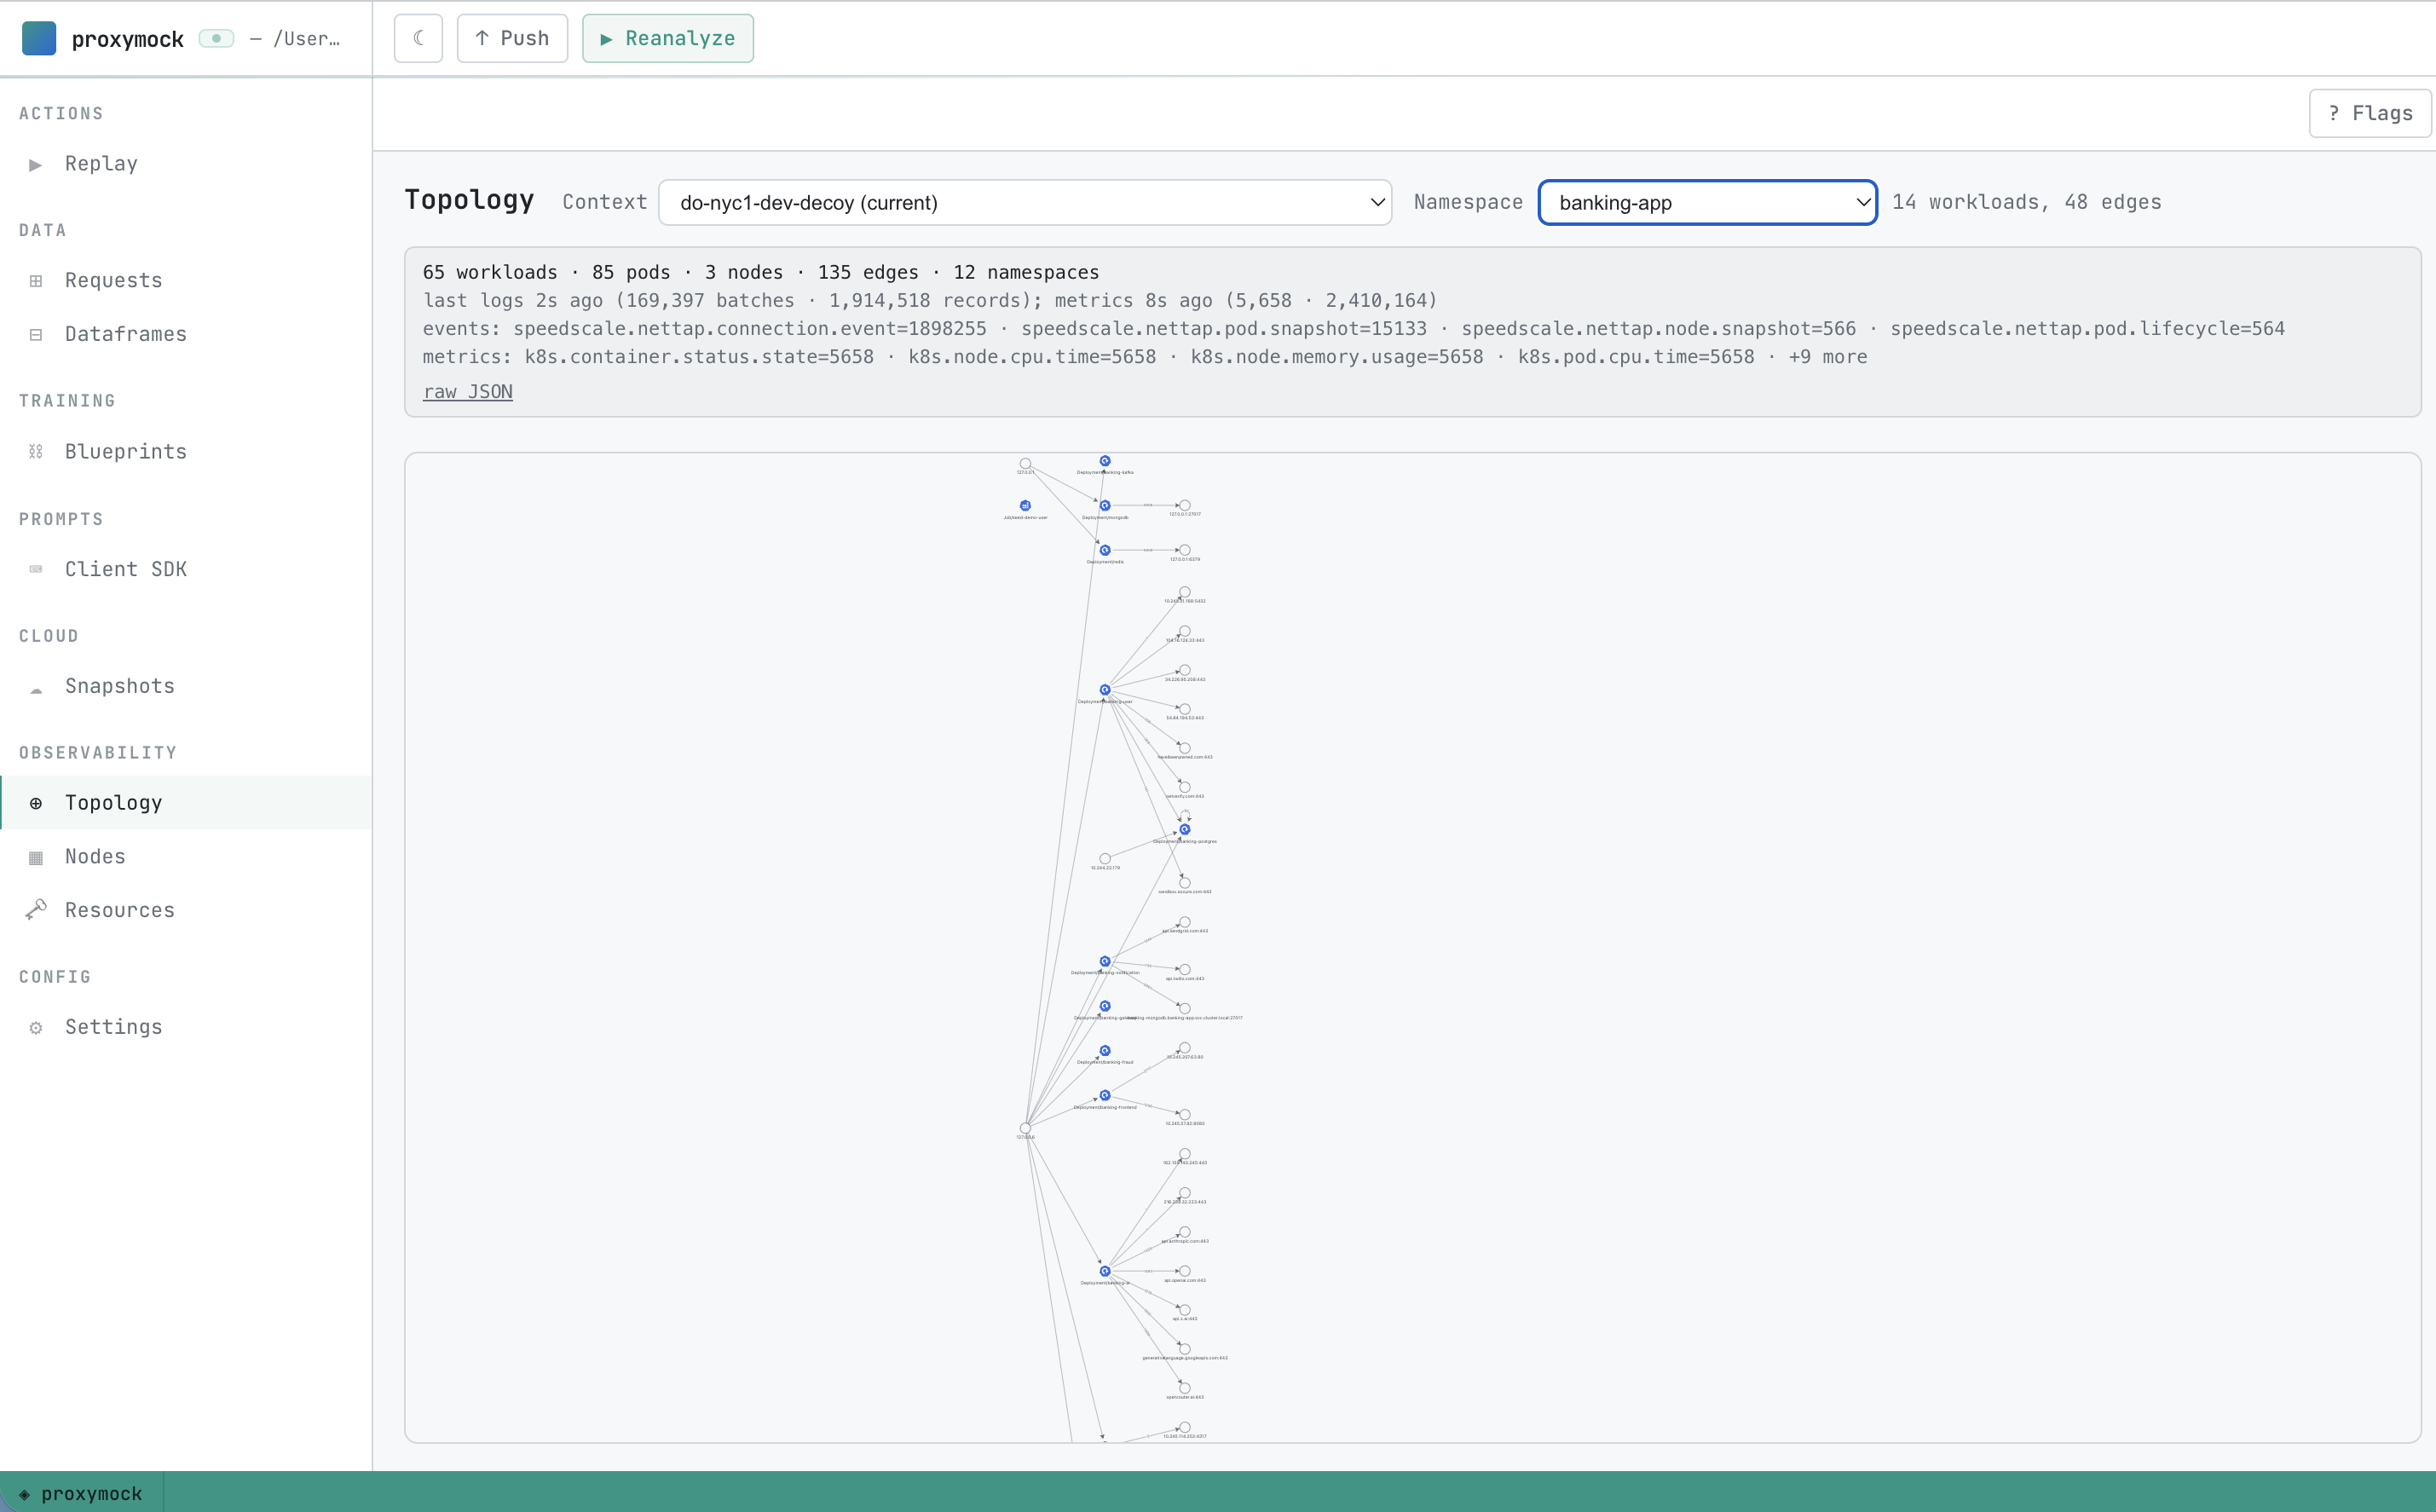
From Observability → Topology:
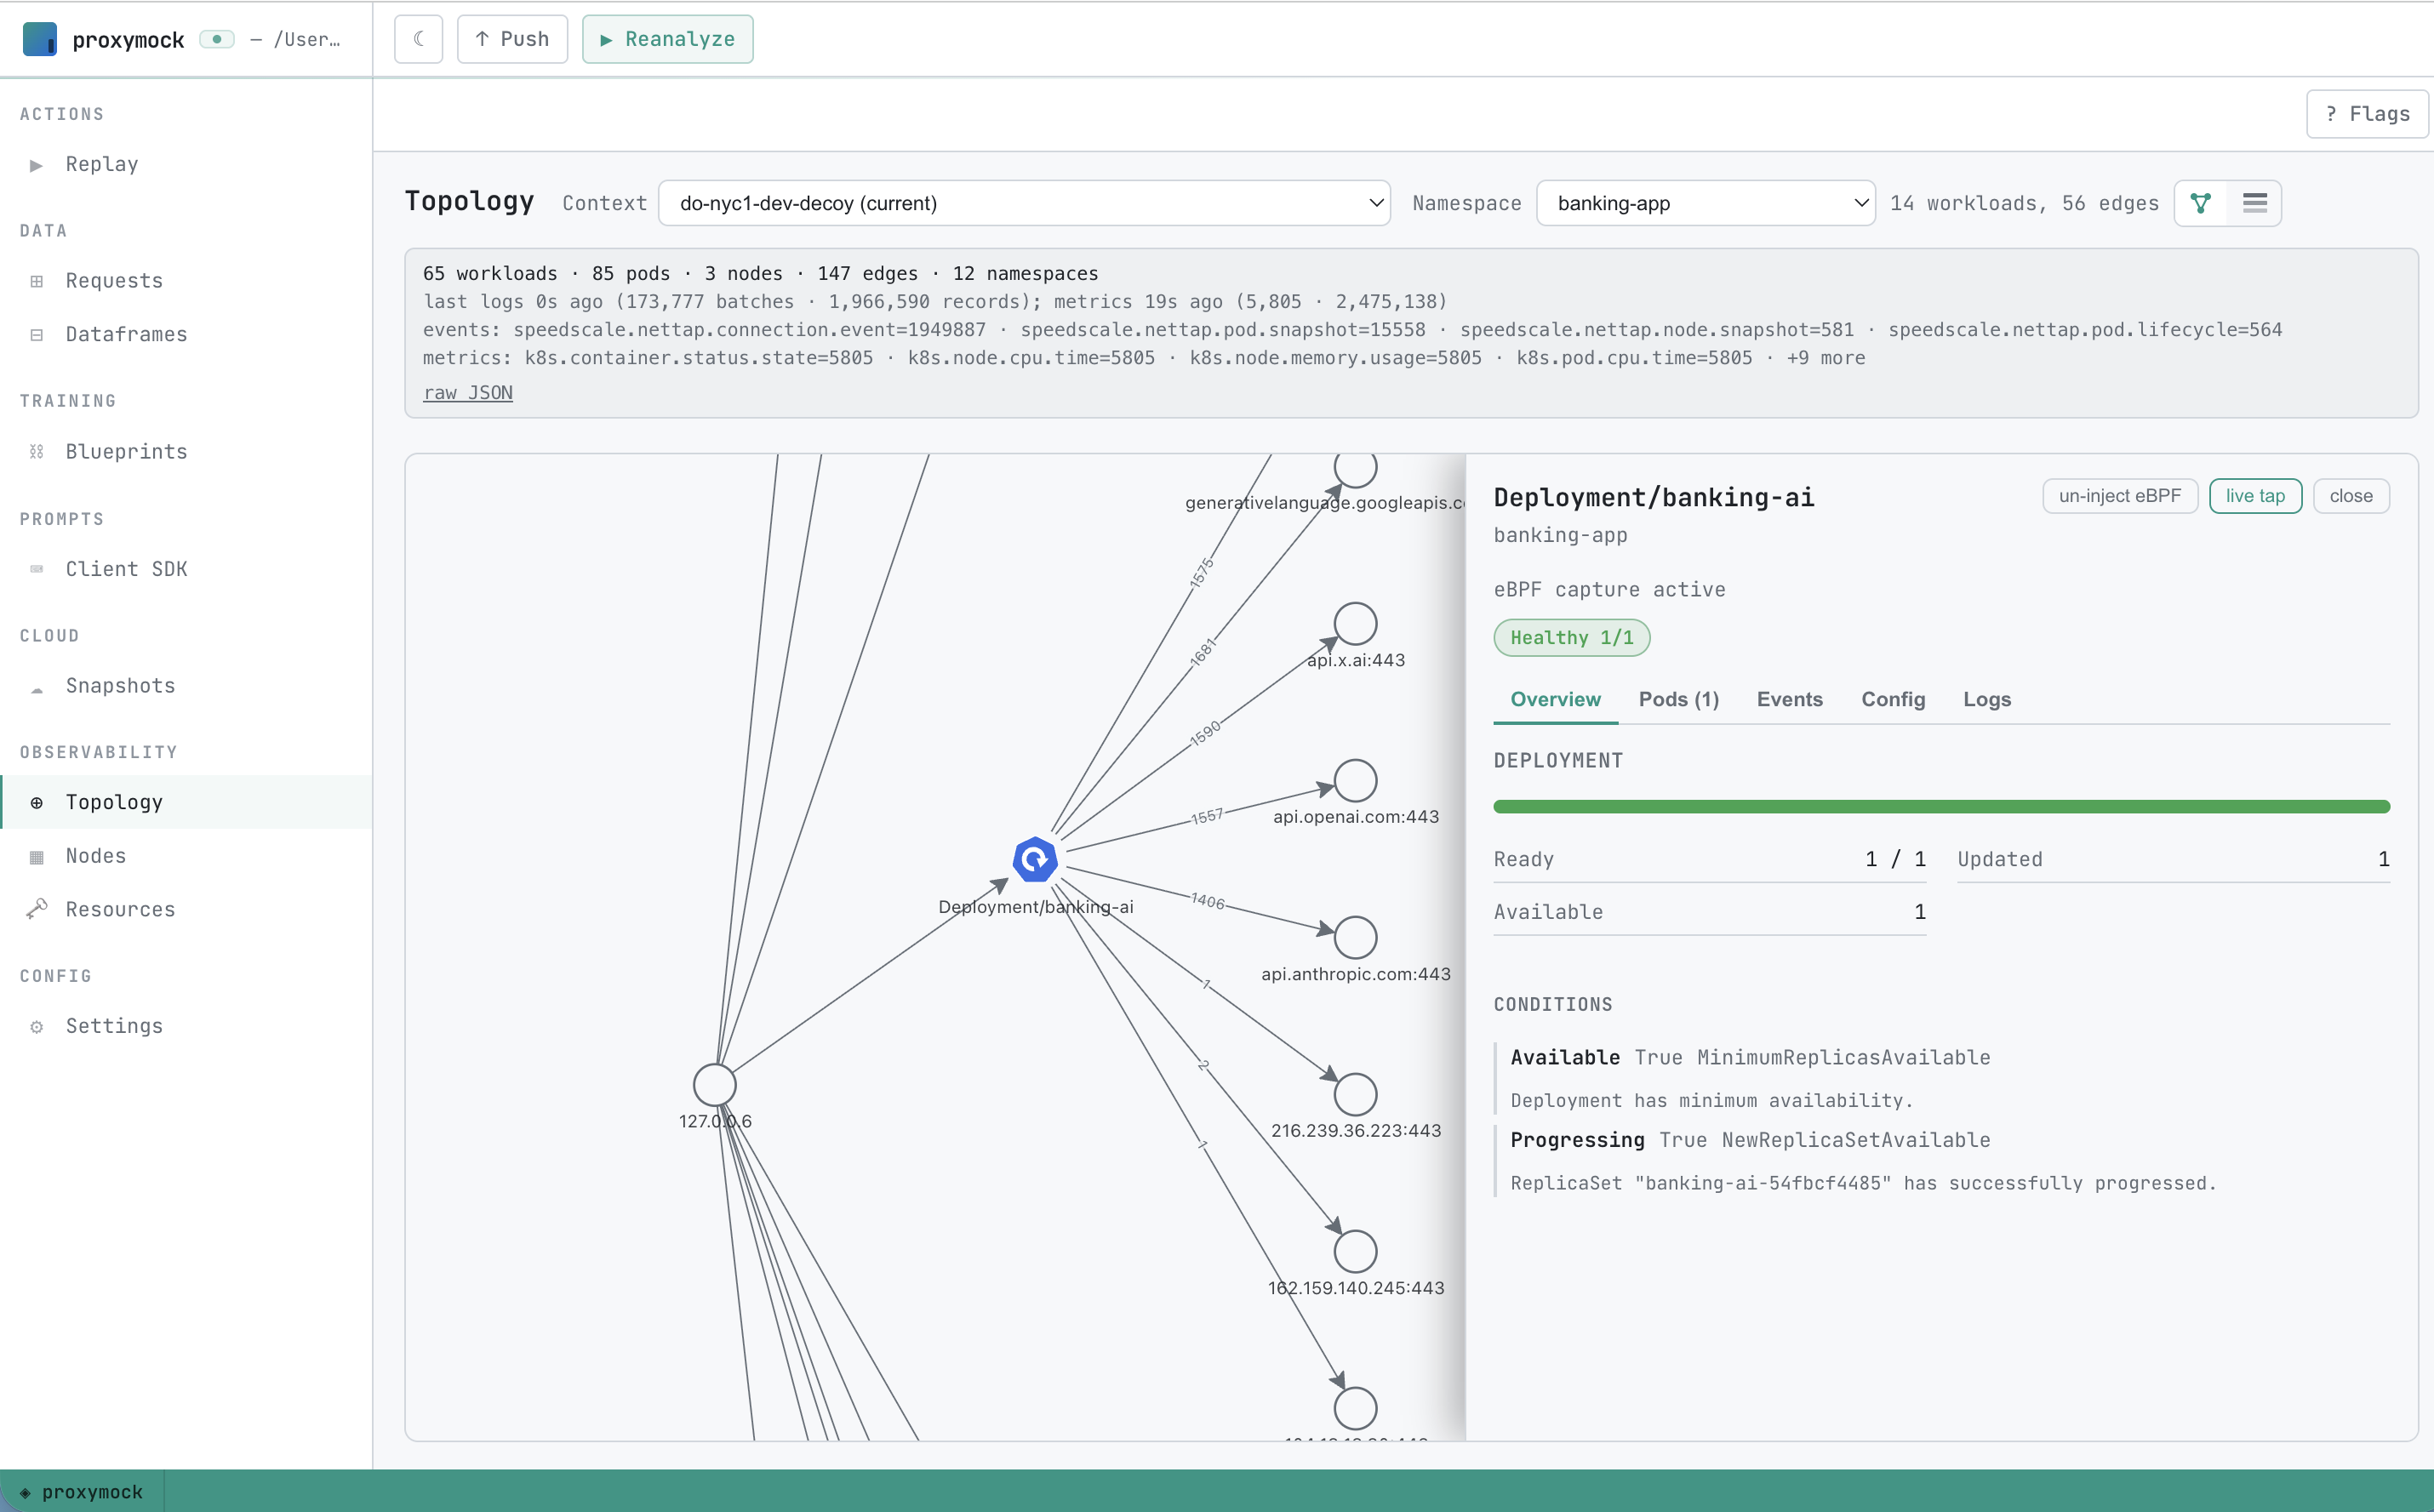
- Pick a namespace and select a workload (Deployment/StatefulSet/etc.)
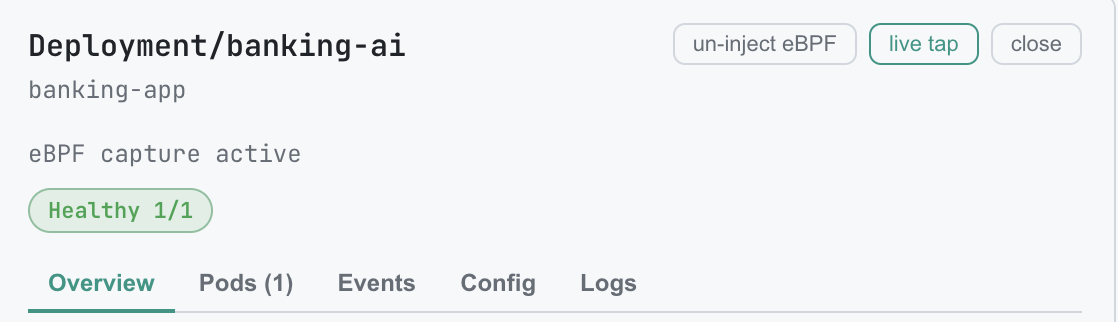
- Open the workload pane and enable Capture (eBPF)
- Generate traffic (e.g., hit your service from a client)
Requests will stream back and appear in the Requests tab. The persistent live-tap card shows active sessions and counters.

Tips:
- Java services: enable the Java agent checkbox when prompted
- Ports: set custom capture ports when your service listens on non-default ports
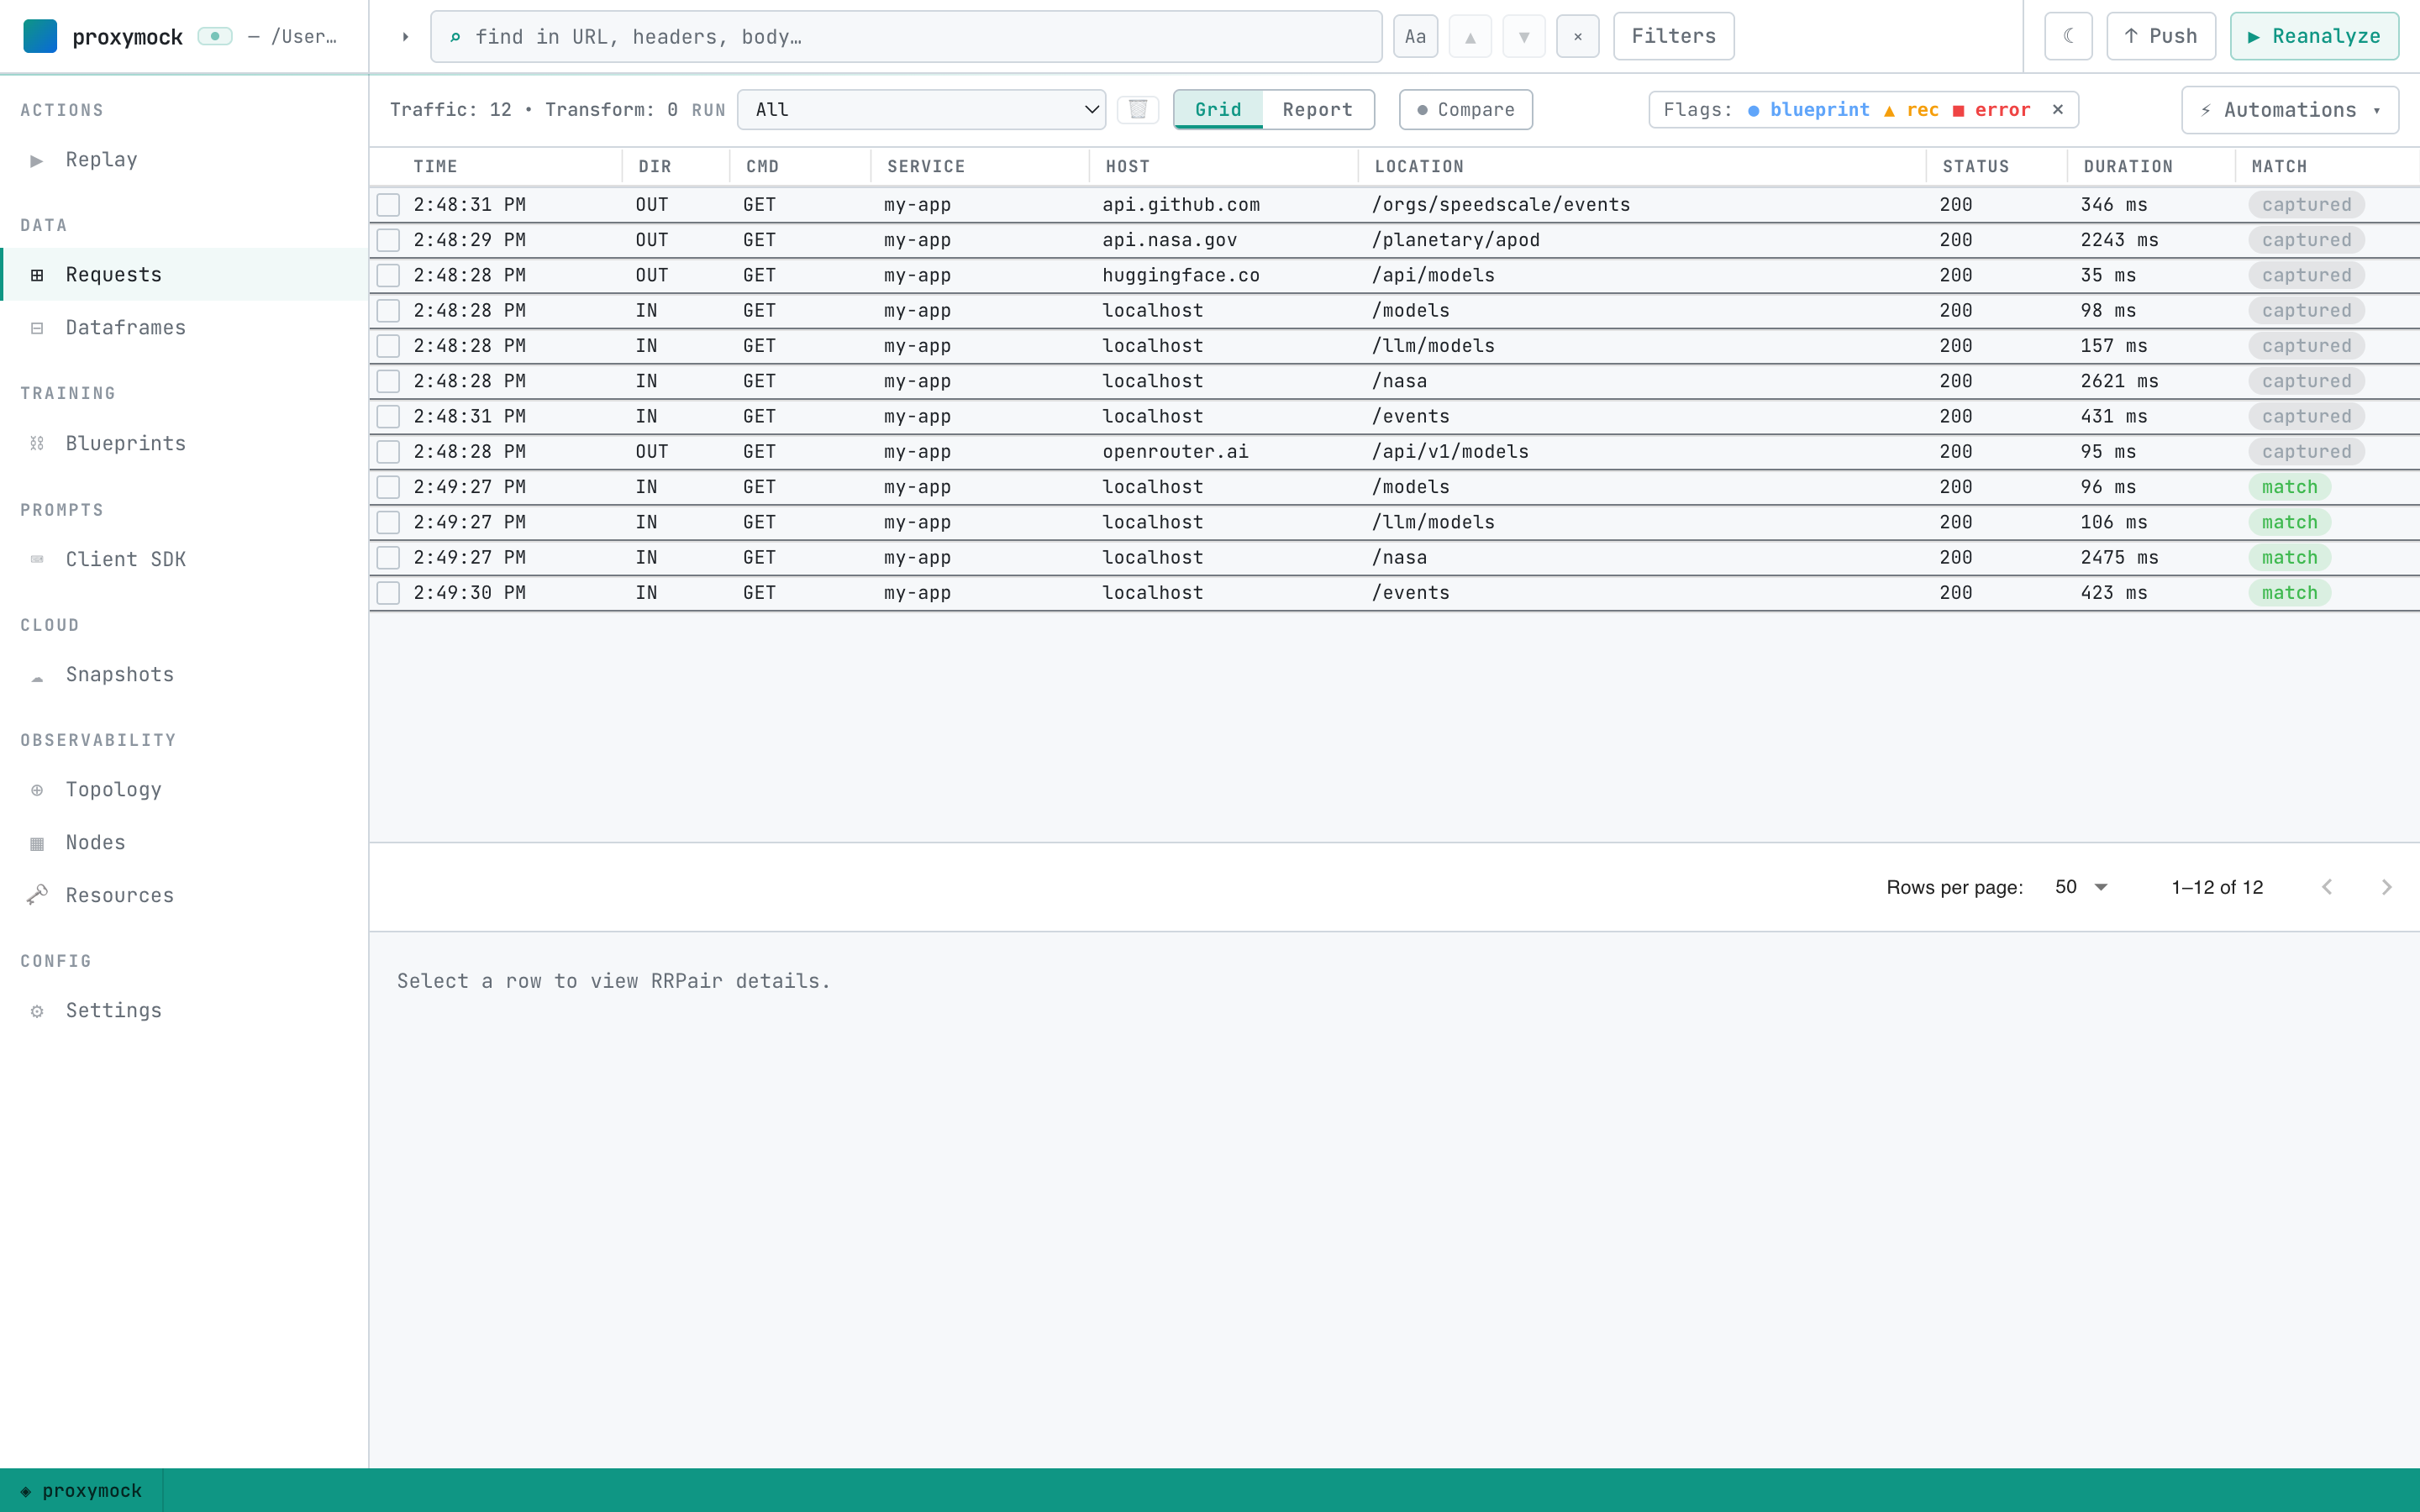
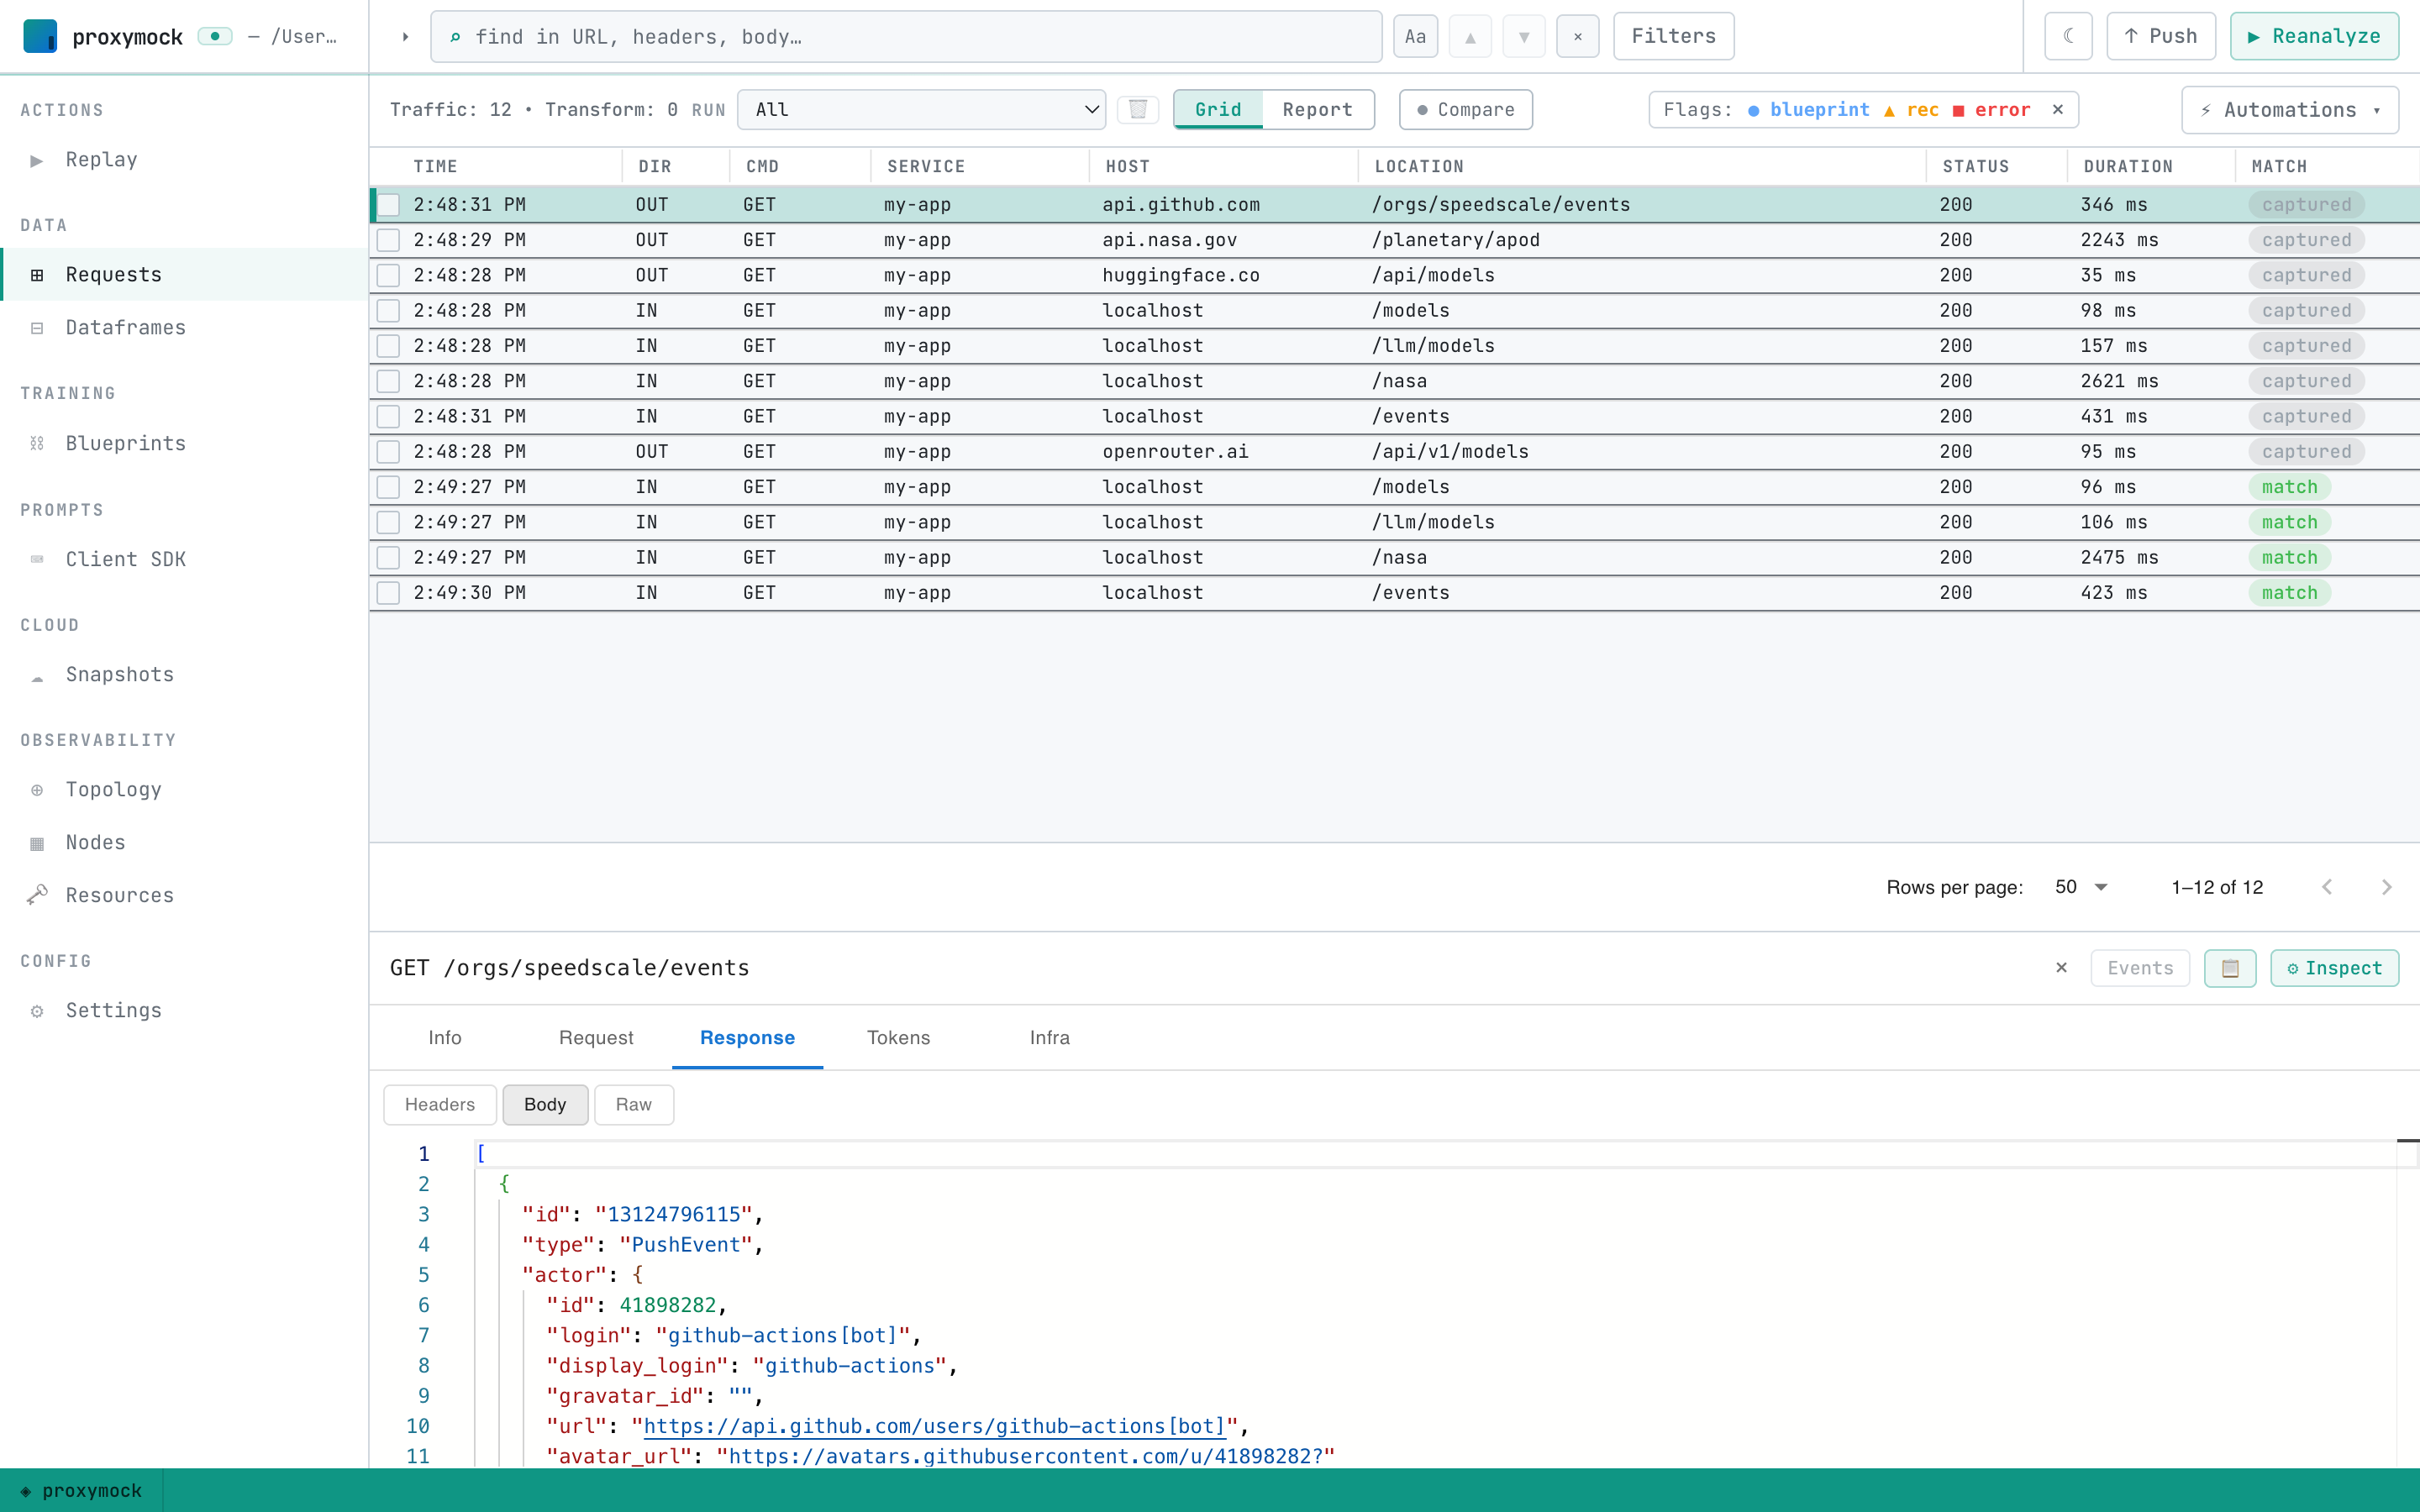
5) Inspect captured traffic
Go to Requests → pick the active run from the Run selector. Inspect inbound/outbound RRPairs, filter by host, method, path, and drill into details.
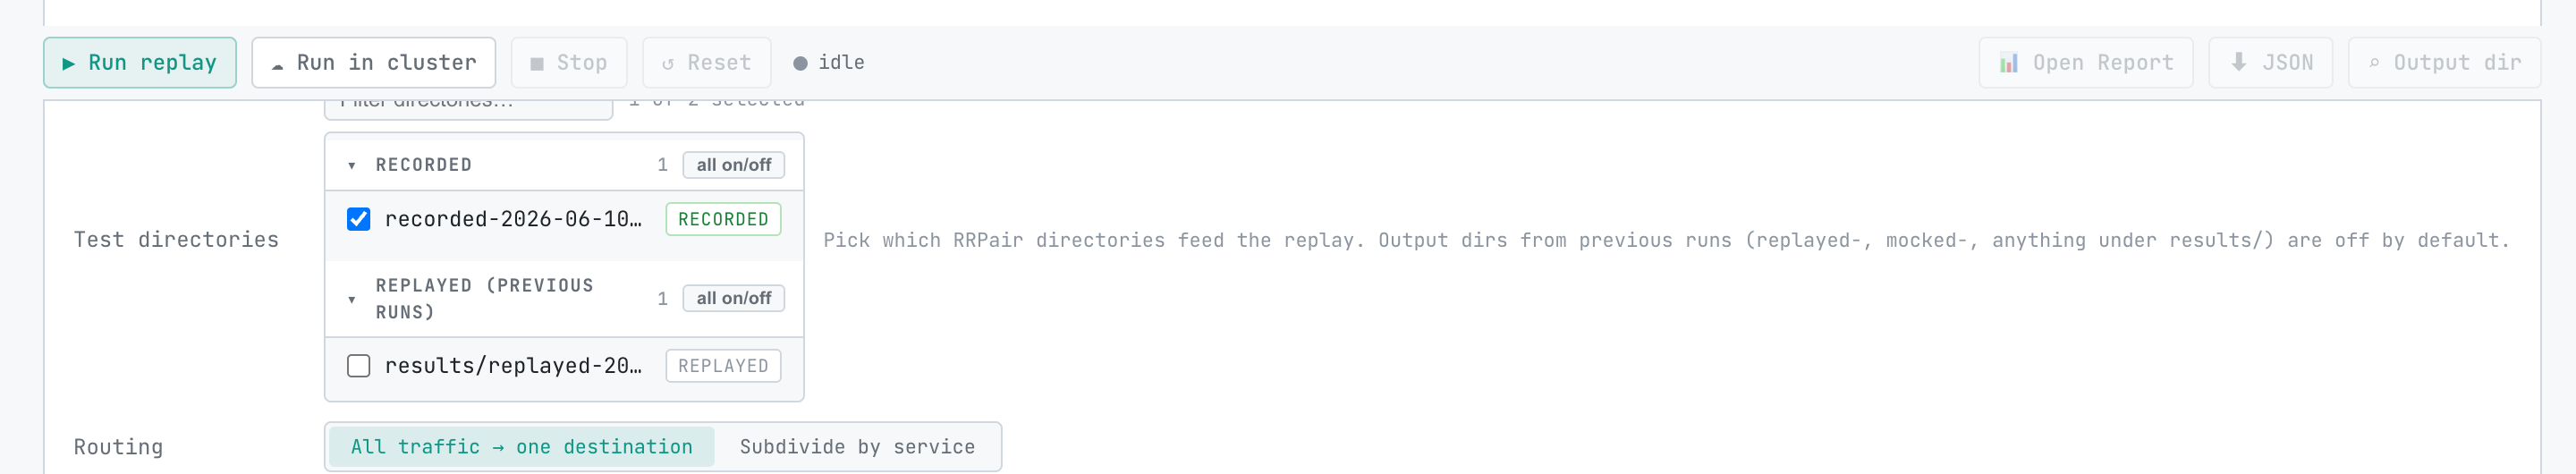
6) Optional — Run in cluster (replay recordings inside your cluster)
You can take any local recordings (./proxymock/recorded-*) and run them against a target in your connected cluster. Results stream back live over the Forwarder tap.
Steps (Replay tab):
- Pick one or more recordings (left side)
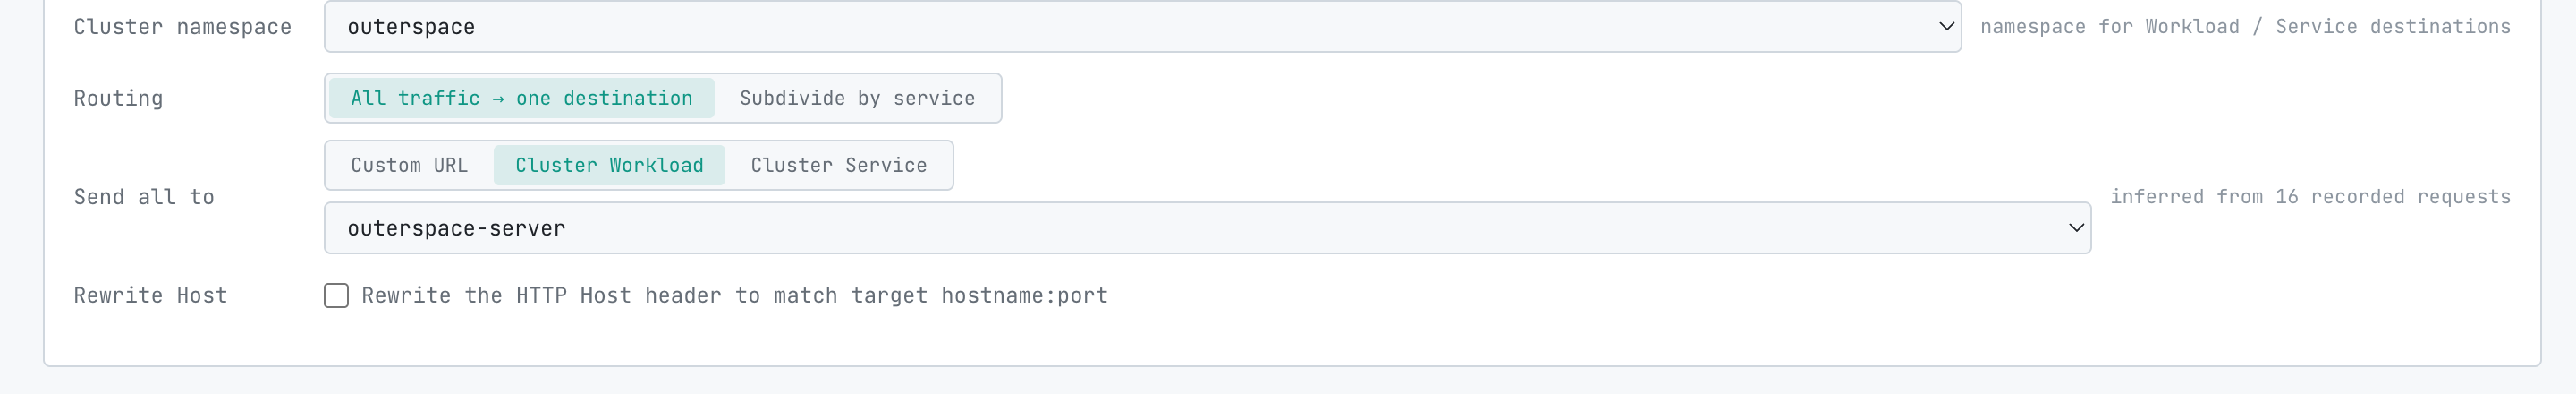
- Source & Target → choose a destination:
- URL (custom) or
- Cluster Workload / Service (preferred)
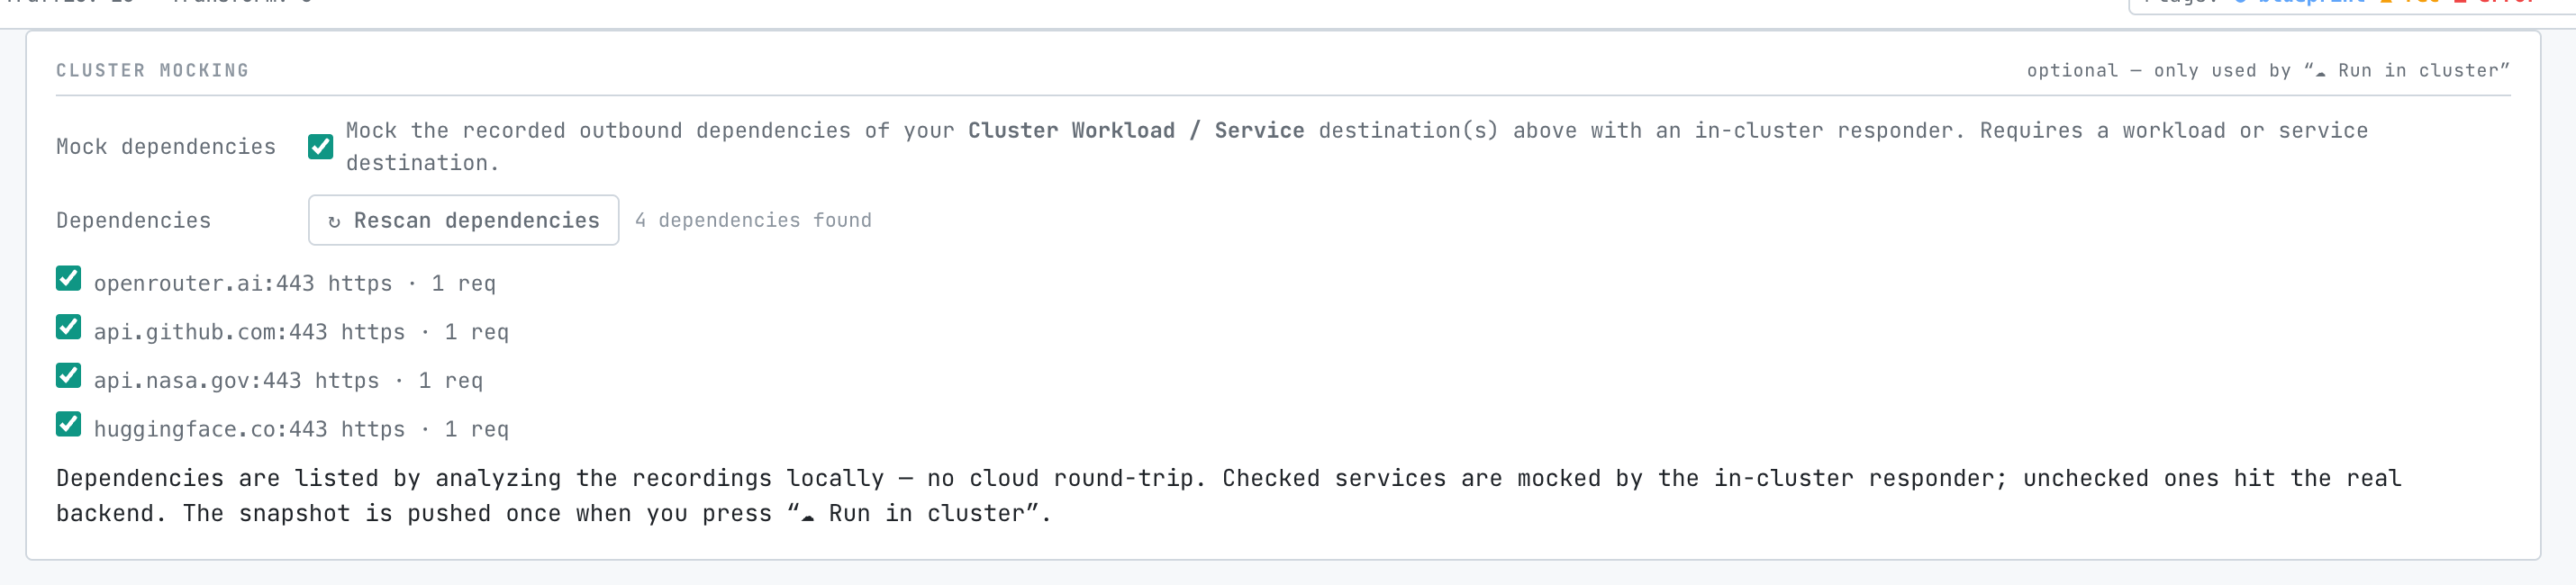
- Optional: enable Mock dependencies, click Rescan to load outbound dependencies, and keep the ones to mock
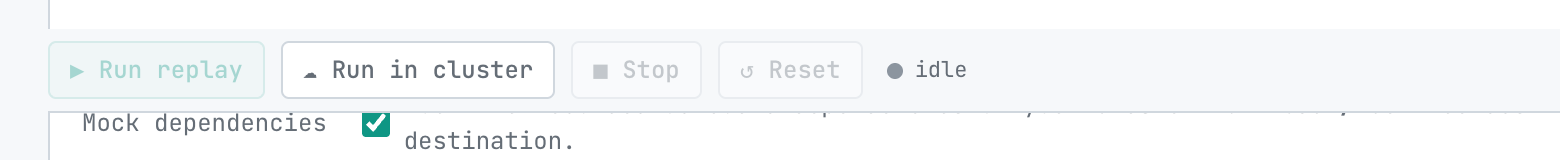
- Click “Run in cluster”
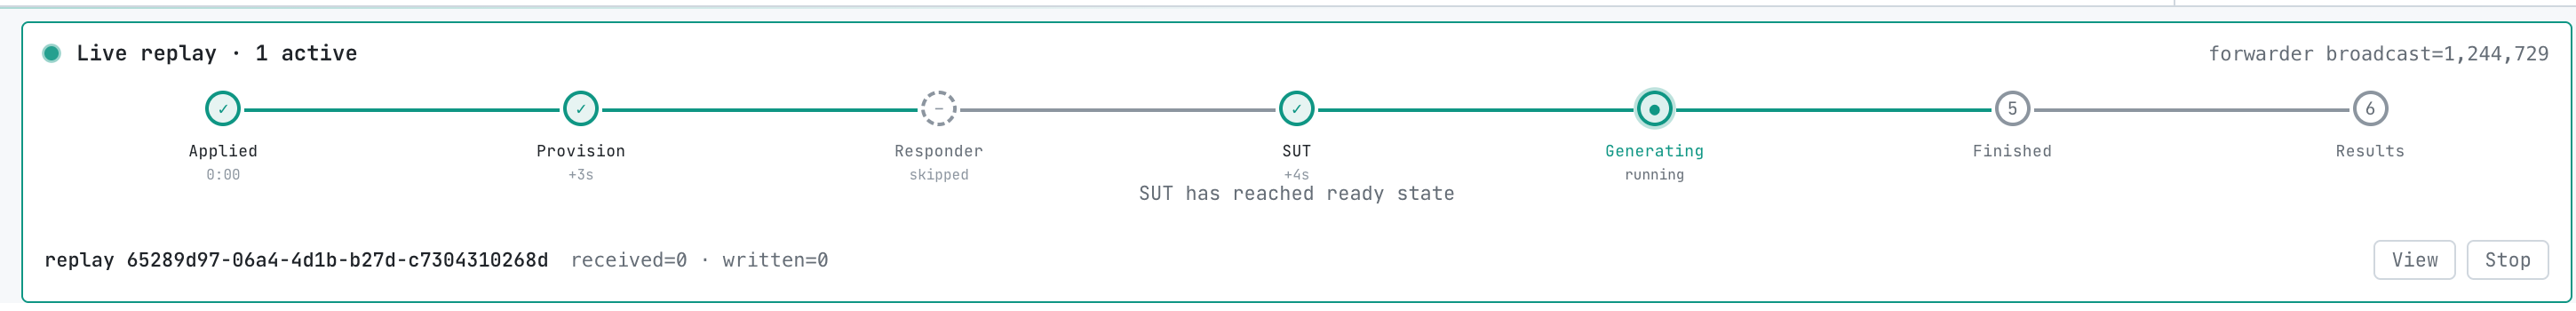
While running:
- A stepper shows progress (build, push, run)
- A bottom drawer streams live generator/responder/SUT logs
- The persistent live-tap card shows ‘Live replay’ with counters
On completion, proxymock web opens the report and scopes the Requests tab to the run output directory.

Troubleshooting:
- If “Run in cluster” is unavailable, ensure you’ve run
proxymock init(browser sign-in) and that Observability shows a connected cluster - Mocking requires a Workload/Service destination (not just a URL)
Next steps
- Local quickstart — record and replay traffic against an app on your machine, no cluster required
- Live Tail (Web) — point proxymock web at a running app and watch RRPairs stream in
- Observability guide — go deeper on topology, eBPF capture, and live-tap workflows
- How it works — architecture, lifecycle, and the RRPair format
- Guides index — credentials swap, CI/CD, OpenAPI, gRPC, databases, and more