Scraping Prometheus Metrics
This document outlines how to configure the goproxy sidecar to expose Prometheus metrics in a Kubernetes environment so that they can be scraped by a Prometheus collector and used for enhanced observability and analysis.
While Speedscale's core function is capturing and replaying API traffic, it operates within your existing Kubernetes infrastructure. By exposing standard Prometheus metrics from your services, you enable your monitoring tools, including Prometheus, to collect this valuable performance data. Speedscale can then complement this by providing detailed traffic behavior and performance analysis during testing and development.
Exposing Prometheus Metrics via UI
The simplest way to turn on Prometheus metrics reporting is to turn on metrics collection in the Infrastructure inject view. Select Infrastructure->Workloads->(Select a) Namespace->(Select a) Workload. Scroll down and you should see Prometheus related options:
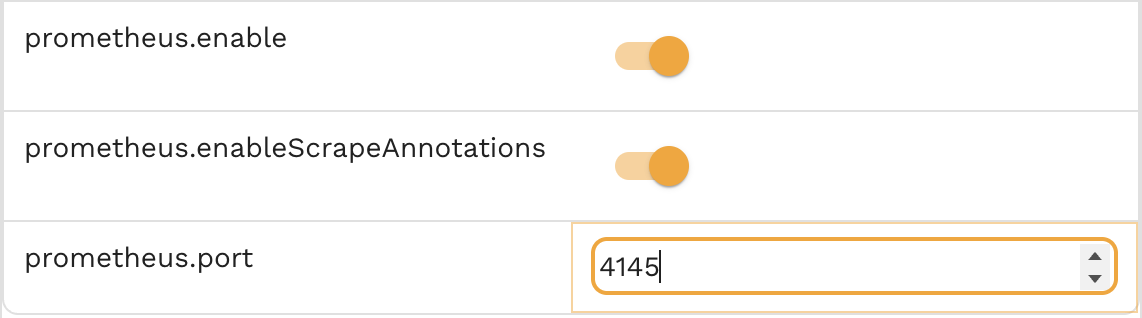
- prometheus.enable - toggle switch for all Prometheus metrics in goproxy
- prometheus.enableScrapeAnnotations - set to true if you want Prometheus annotations added to the goproxy workload (prometheus.io/scrape, etc)
- prometheus.port - port to listen for Prometheus requests on (default: 4145)
If you are setting your Prometheus scrape points in a central config file (like prometheus.yml) then you likely don't need prometheus.enableScrapeAnnotations set to true. This option adds the annotations that tell Prometheus to scrape this pod. For example:
metadata:
  annotations:
    prometheus.io/scrape: "true"
    prometheus.io/path: "/metrics"
    prometheus.io/port: "4145"
If your app already produces Prometheus metrics then the new goproxy port will be added to the existing list. If your app uses a different path than /metrics then you should set different scrape points in your central Prometheus configuration file. You can change the sidecar port to prevent collisions.
Exposing Prometheus Metrics via Annotations
If you do not have Speedscale remote control available then you will want to enable scraping directly in your Kubernetes cluster. Use this method if you cannot use the Speedscale UI.
Add the following annotations to your workload:
metadata:
  annotations:
    sidecar.speedscale.com/prometheus-port: "4145"
    sidecar.speedscale.com/prometheus-enable-scrape-annotations: "true"
This will cause the Speedscale operator to set METRICS_HTTP_ENABLE=true and METRICS_HTTP_PORT=4145 on the workload. This will also turn on the containerPort for port 4145