Tutorial
- Local-first recording: use
proxymockfor desktop workflows when you want captured traffic to stay local by default. - Enterprise boundary control: use Bring Your Own Cloud (BYOC) when you need customer-controlled cloud isolation.
- Sensitive data controls: enable DLP so sensitive fields are redacted before data leaves your network.
In this guide we're going to use this repo's example app in the java directory to capture, transform and replay traffic with mocks.
Prerequisites
- CLI speedctl is installed
- CLI proxymock is installed
- After installing CLI,
SPEEDSCALE_HOMEshould be set correctly, if you don't see it runproxymock initagain and allow it to update your rcfile. - Clone the repo: https://github.com/speedscale/demo
- Java is present and
JAVA_HOMEis set correctly (on MacOS you can run/usr/libexec/java_hometo find the correctJAVA_HOME) - Install
jqandmakeif not already on your desktop (brew install jqandbrew install makeon MacOS for example)
The App
The app is a Java Spring Boot web server with authenticated endpoints that makes requests out to a few external services. The project README (at java/README.md) shows ways to run the app locally, in Docker and in Kubernetes. Speedscale can be configured to be compatible with whichever way you choose to deploy the app. Note that for this test run we'll disable DLP for simplicity, but production workflows should enable DLP before sending captured traffic outside your environment.
Capture
Make sure you navigate to the java subdirectory within the demo repository.
- Kubernetes
- Docker
- Local
- Install the operator
- Recommended: enable the eBPF collector to capture traffic without proxies or app changes. Follow the Helm-based setup to target the demo namespace/workload.
- Fallback: if eBPF is not suitable in your cluster, deploy the demo app with the Speedscale sidecar by running:
make kube-capture
- Validate the app was deployed properly with:
kubectl -n default get pods
Depending on your chosen capture method you may see either 1/1 (eBPF collector) or 2/2 (application + sidecar) for the java-server pod.
NAME                           READY   STATUS    RESTARTS   AGE
java-client-54ccddd5cd-tthld   1/1     Running   0          37s
java-server-597577977-bthvl    2/2     Running   0          37s
This should start generating traffic that you can see in the Speedscale UI within a couple of minutes.
- Generate a jks for the Java app:
docker run --rm -v ~/.speedscale/certs:/speedscale openjdk bash -c 'keytool -importcert -noprompt -cacerts -storepass changeit -alias speedscale -file /speedscale/tls.crt && cp ${JAVA_HOME}/lib/security/cacerts /speedscale/cacerts.jks'
- Run:
speedctl install
Choose the Docker option and then the Capture option (option 1). You can name the service anything you want, the default port setting of 8080 is necessary.
- Run the following to bring up the Speedscale capture components:
docker compose --file speedscale-docker-capture.yaml up -d
- Run in your current terminal window:
make compose-capture
- Open a new terminal window and run:
make client-capture
This should start generating traffic that you can see in the Speedscale UI within a couple of minutes.
- Generate local certs by running the following command (it should say "Certificate was added to keystore"):
proxymock certs --jks
- Start the capture system with this command:
proxymock record --app-port 8080
- Open another terminal window to run the
java-serverprogram:
make local-capture
- Open a third terminal window to run the client application:
make client-capture
- This will generate traffic, and you can view the traffic with this command:
proxymock inspect --in proxymock/recorded-YOUR_TIMESTAMP
- If you want to push this data to Speedscale cloud you can with the command:
proxymock cloud push snapshot --in proxymock/recorded-YOUR_TIMESTAMP
Analyze
After a few minutes you should be able to see your traffic in the Speedscale dashboard. Make sure to select the the same service name that you entered in speedctl install from the traffic dropdown. You should be able to see the inbound and outbound calls for this app as shown below.
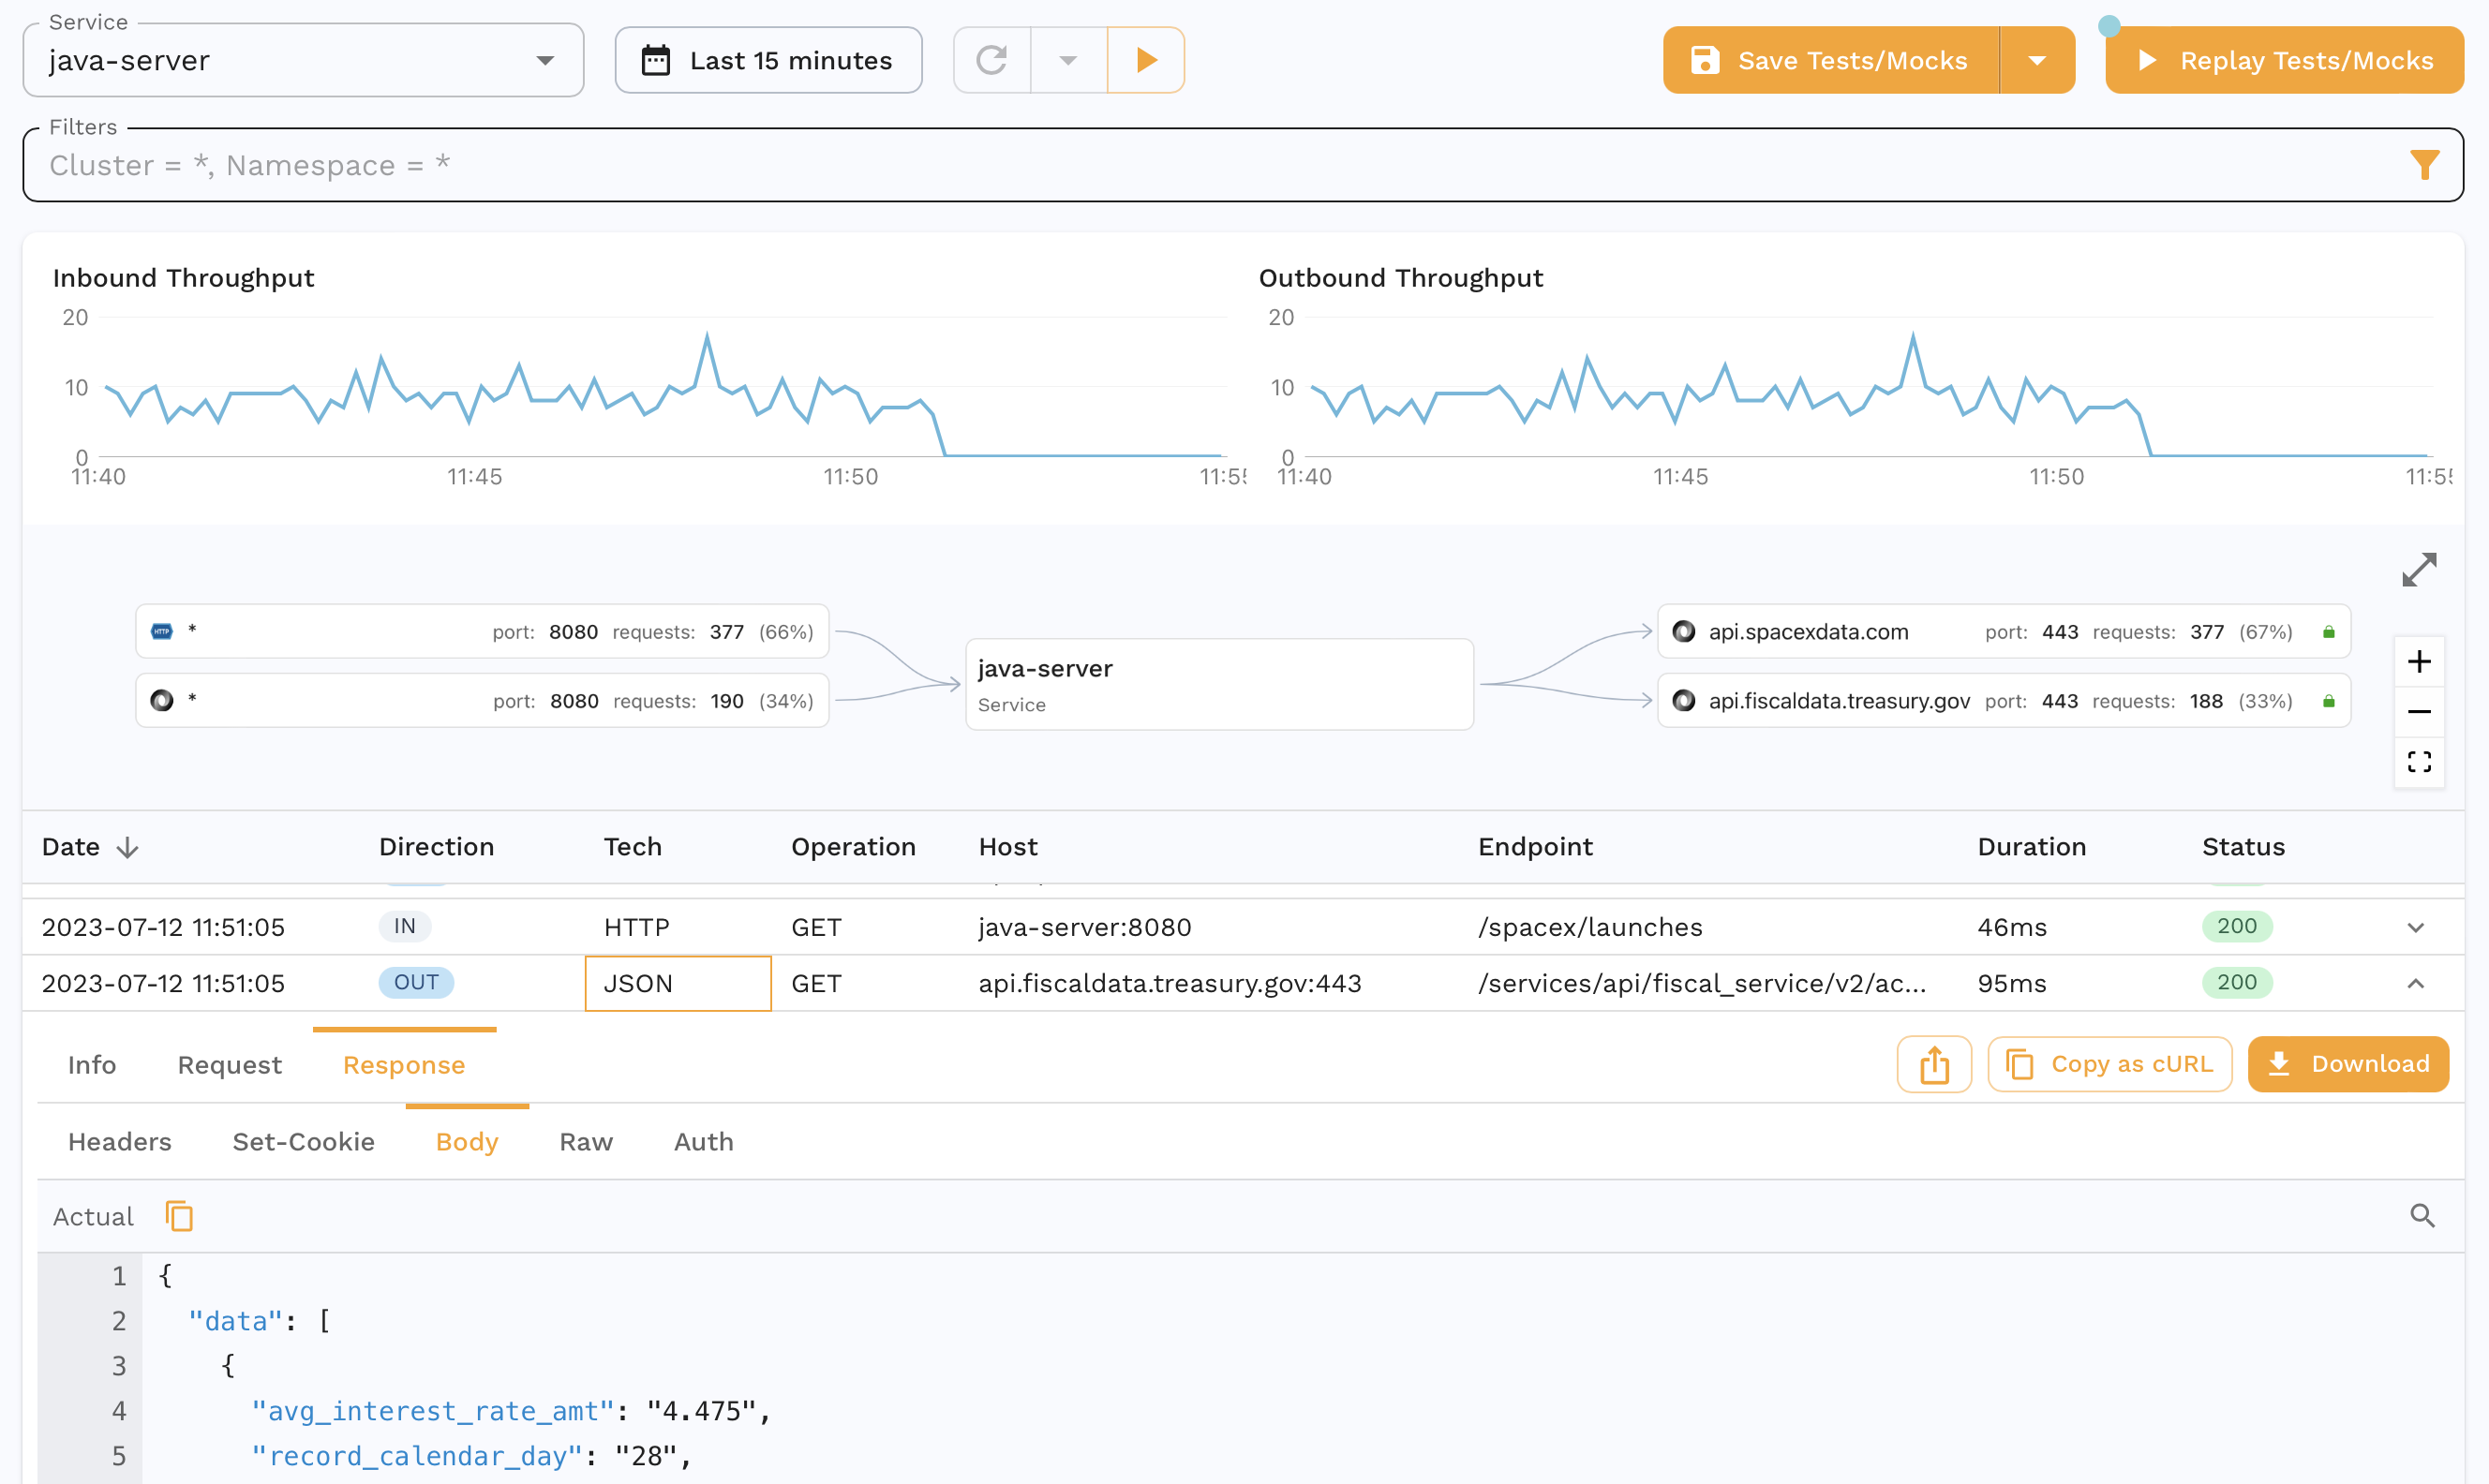
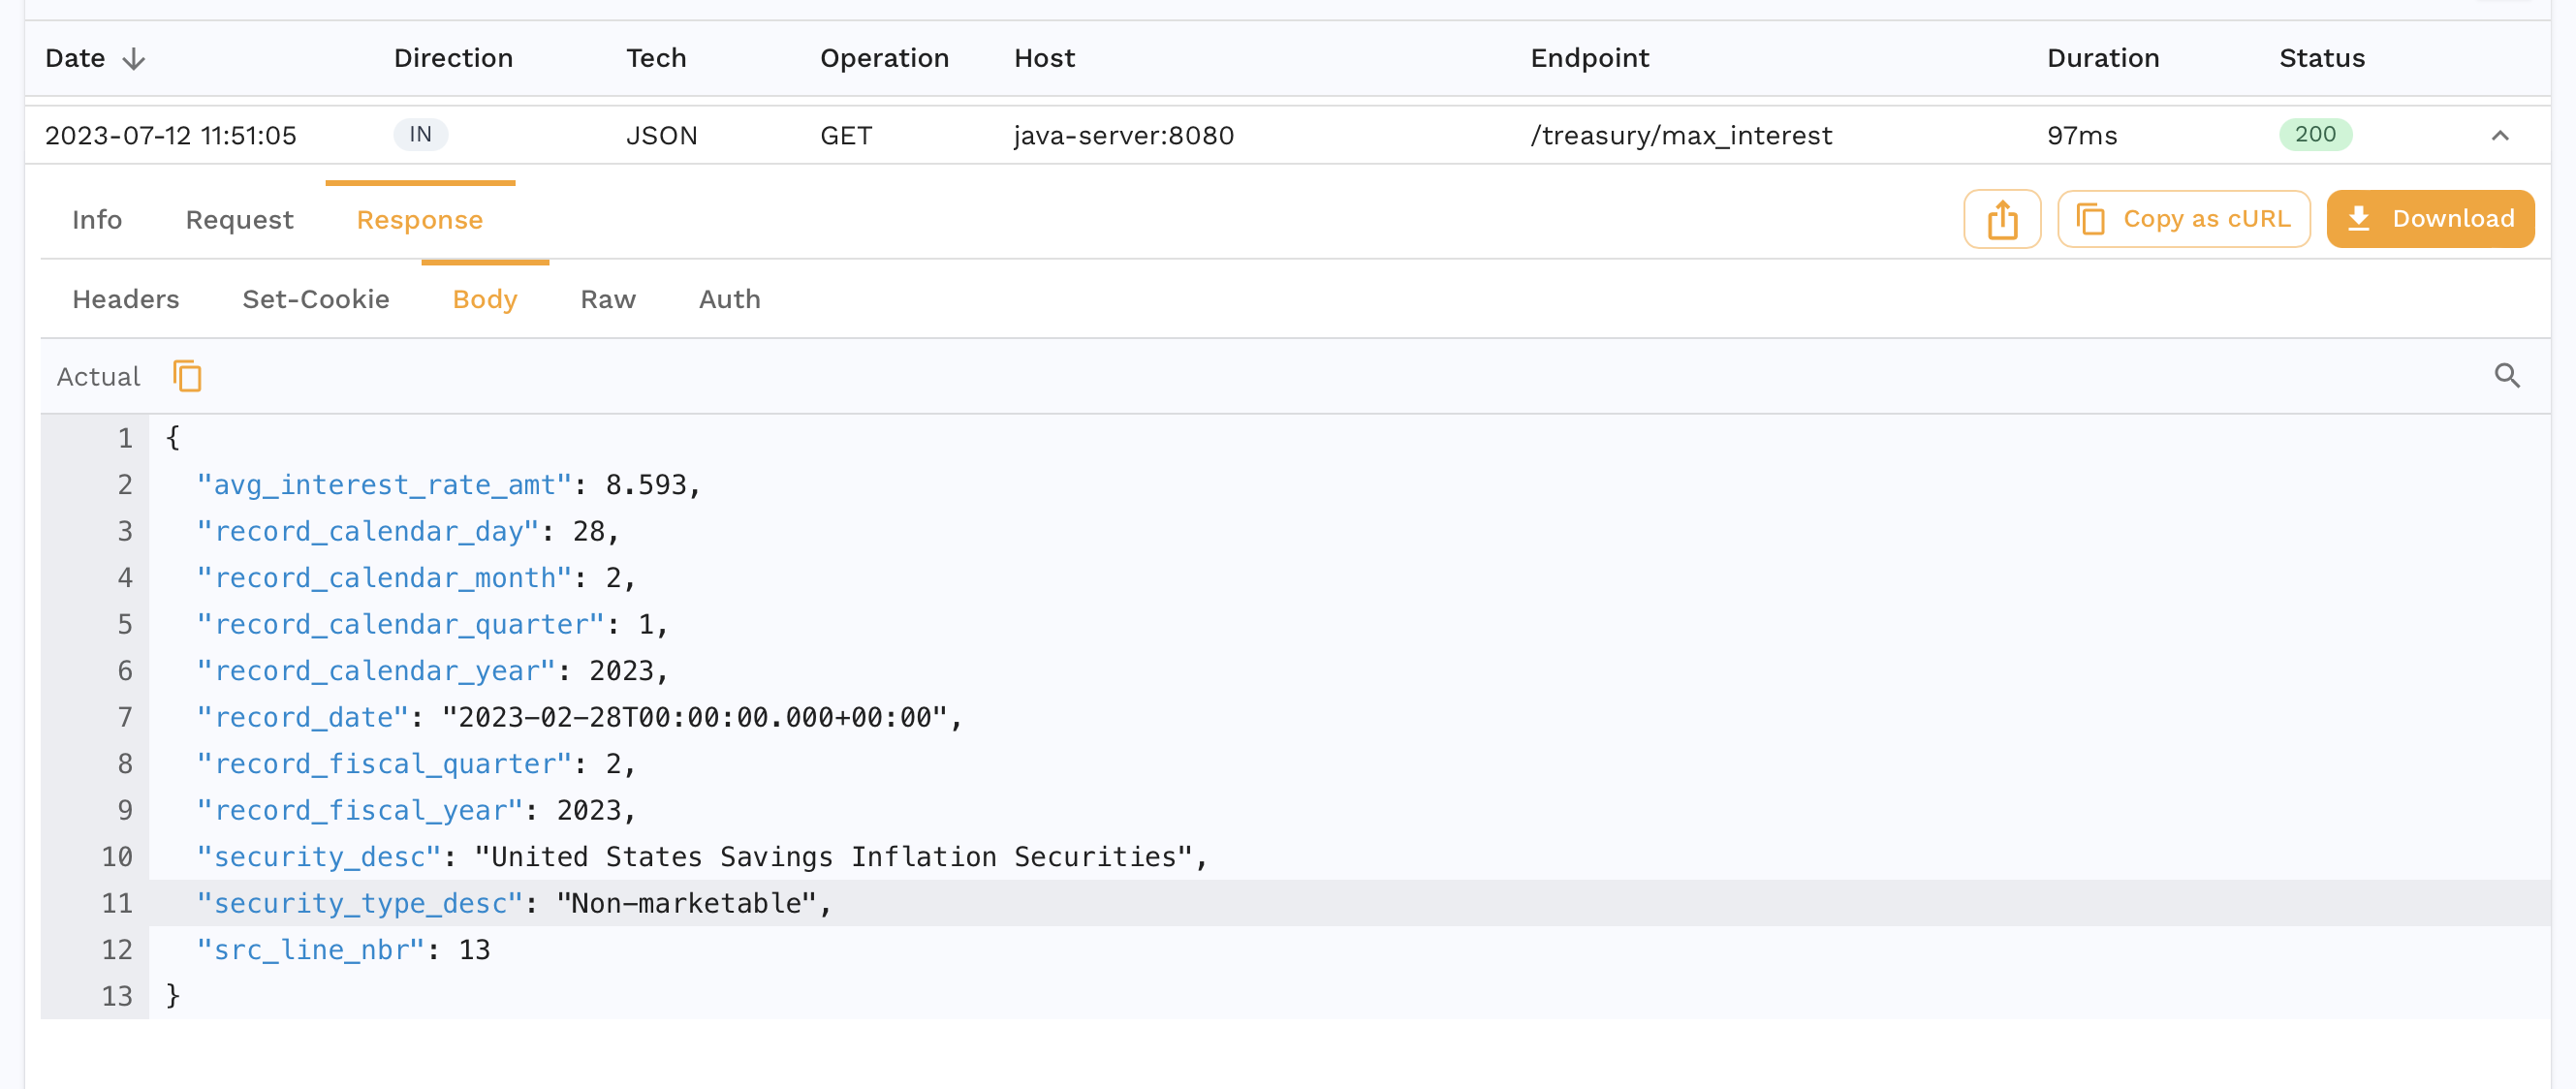
You can also drill down into specific requests-response pairs (RRPairs). For eg. we see the request we make to our app to get the max interest rate for treasuries.
And we can also see the outbound request our app makes to the Treasury API to fulfill this request.
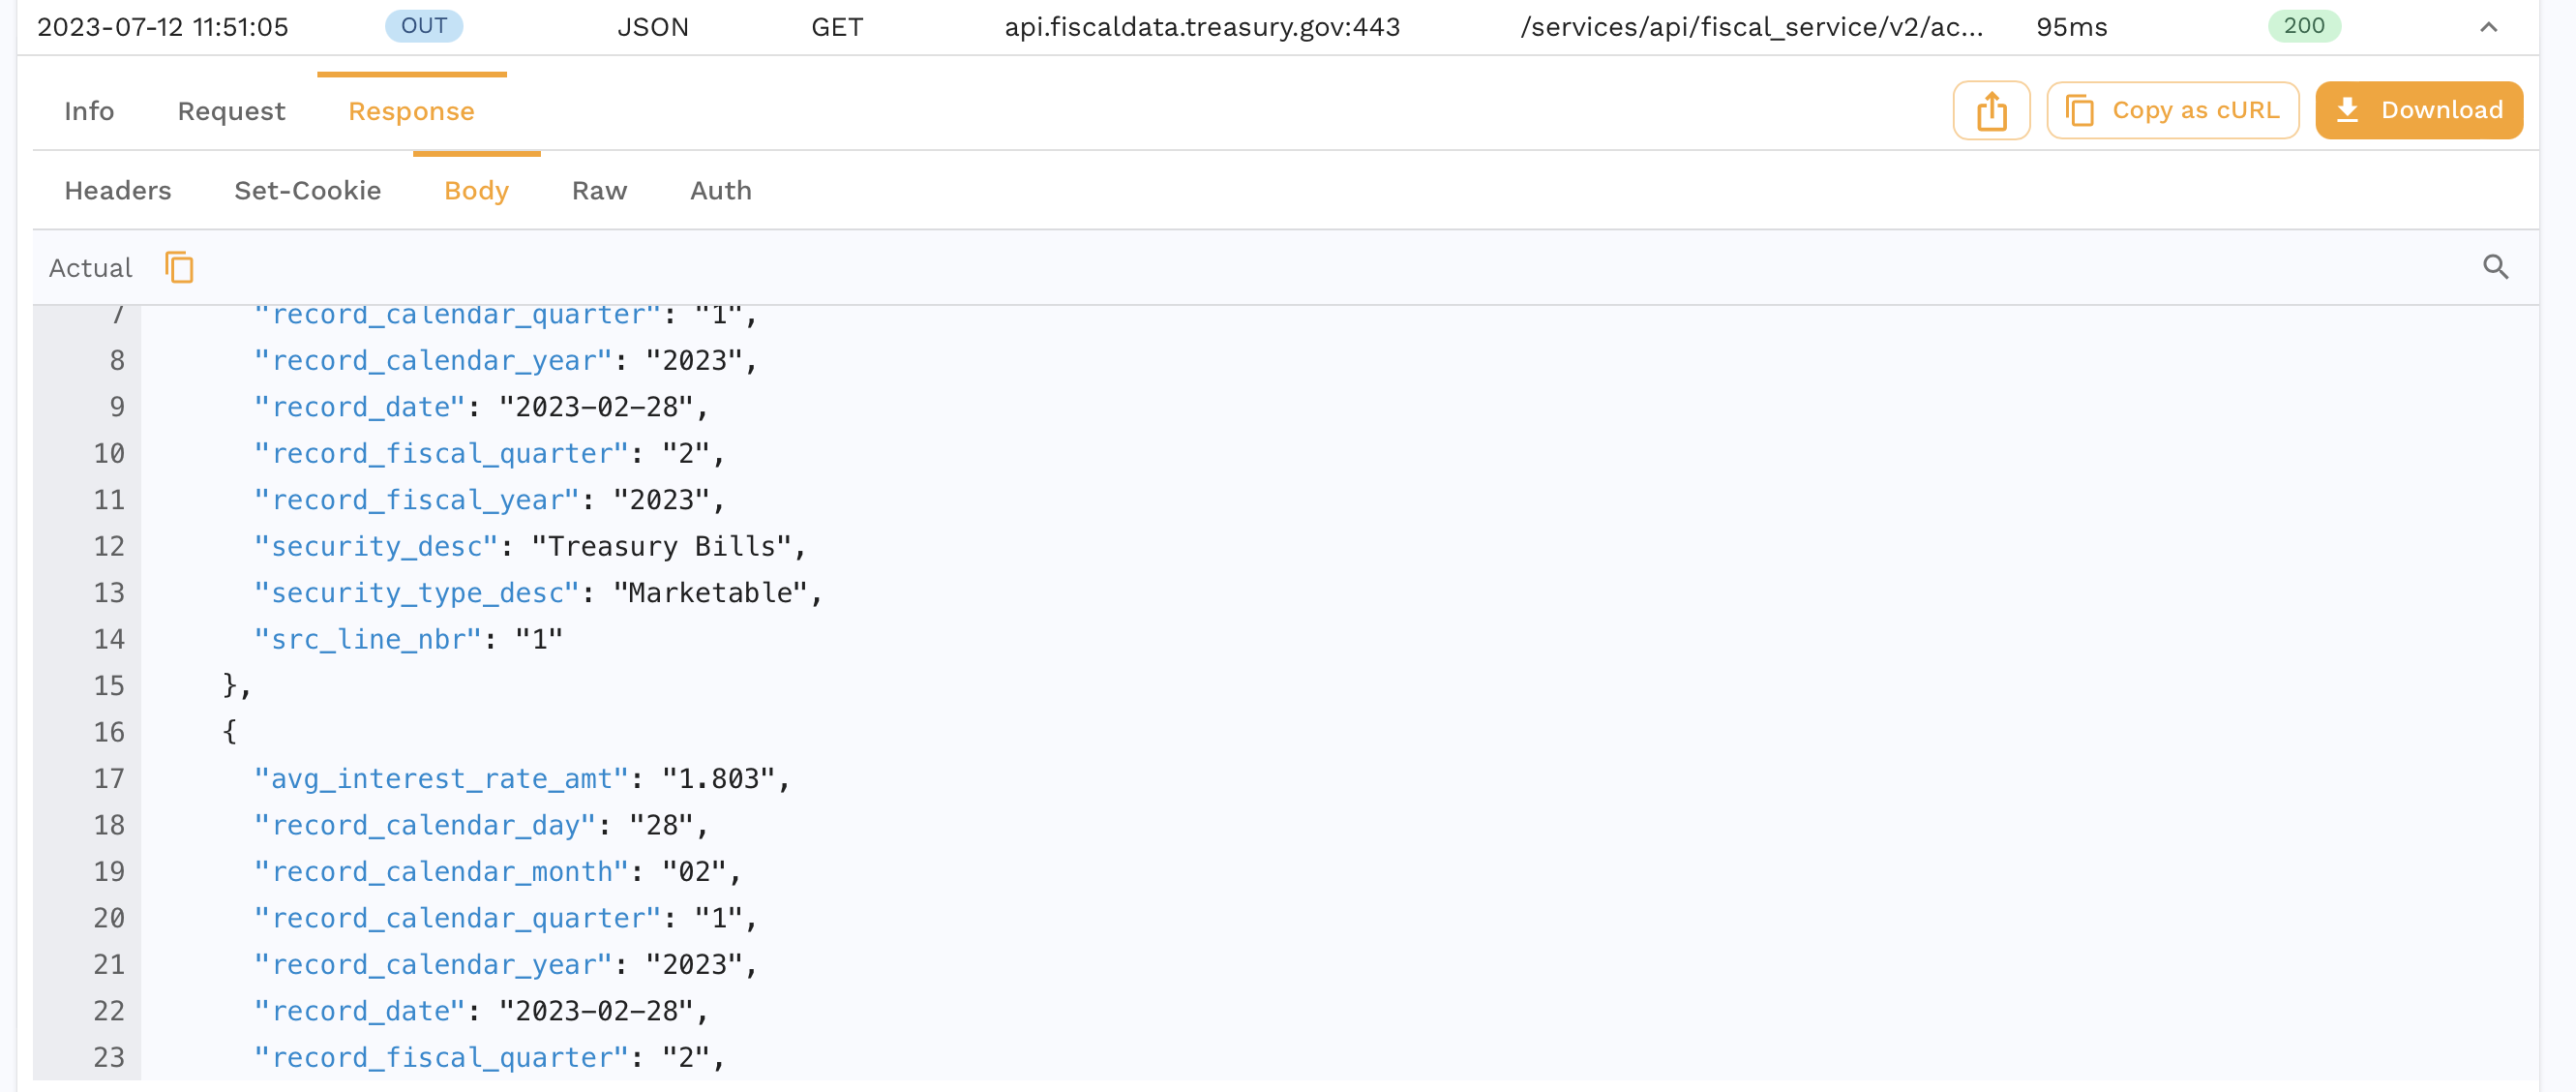
You can and inspect it further or you can skip ahead to running a replay which will also create a snapshot as a side effect.
Replay
We're now going to run a replay for this captured traffic.
- Kubernetes
- Docker
- Local
Click the Replay as Tests/Mocks button on the top right and walk through the wizard. All the default settings are ok here. You can also do this outside of the UI with more instructions here.
- Click the
Save to Tests/Mocksbutton in the top right. All the default settings are ok here. You can find more detailed instructions in the Create a Snapshot section. - Once you see the Snapshot summary, copy the snapshot ID from the URL or by clicking the
Copy Snapshot IDoption from the three dot menu. - Run:
speedctl install
Choose the Docker option and then Replay (option 3).
- Select your service and the standard test config. Make sure you select the same service name you entered during the capture phase.
- Input the Snapshot ID from step 1, the port should still be
8080 - Run in one terminal window:
make compose-replay
- Run in another window to start the replay:
export TEST_REPORT_ID=$(uuidgen | tr '[:upper:]' '[:lower:]'); docker compose --file speedscale-docker-replay.yaml up -d && echo "Your test report can be found at: https://app.speedscale.com/reports/${TEST_REPORT_ID}"
- Click the
Save to Tests/Mocksbutton in the top right. All the default settings are ok here. You can find more detailed instructions in the Create a Snapshot section. - Once you see the Snapshot summary, copy the snapshot ID from the URL or by clicking the
Copy Snapshot IDoption from the three dot menu. - This is how you run the application:
make local-replay
- In another terminal window, download the modified snapshot locally with:
proxymock cloud pull snapshot SNAPSHOT_ID
- Now you can run the mock server like so:
proxymock mock --in proxymock/snapshot-SNAPSHOT_ID
- In a third terminal window, you can run the test replay:
proxymock replay --in proxymock/snapshot-SNAPSHOT_ID
Making sense of a Replay
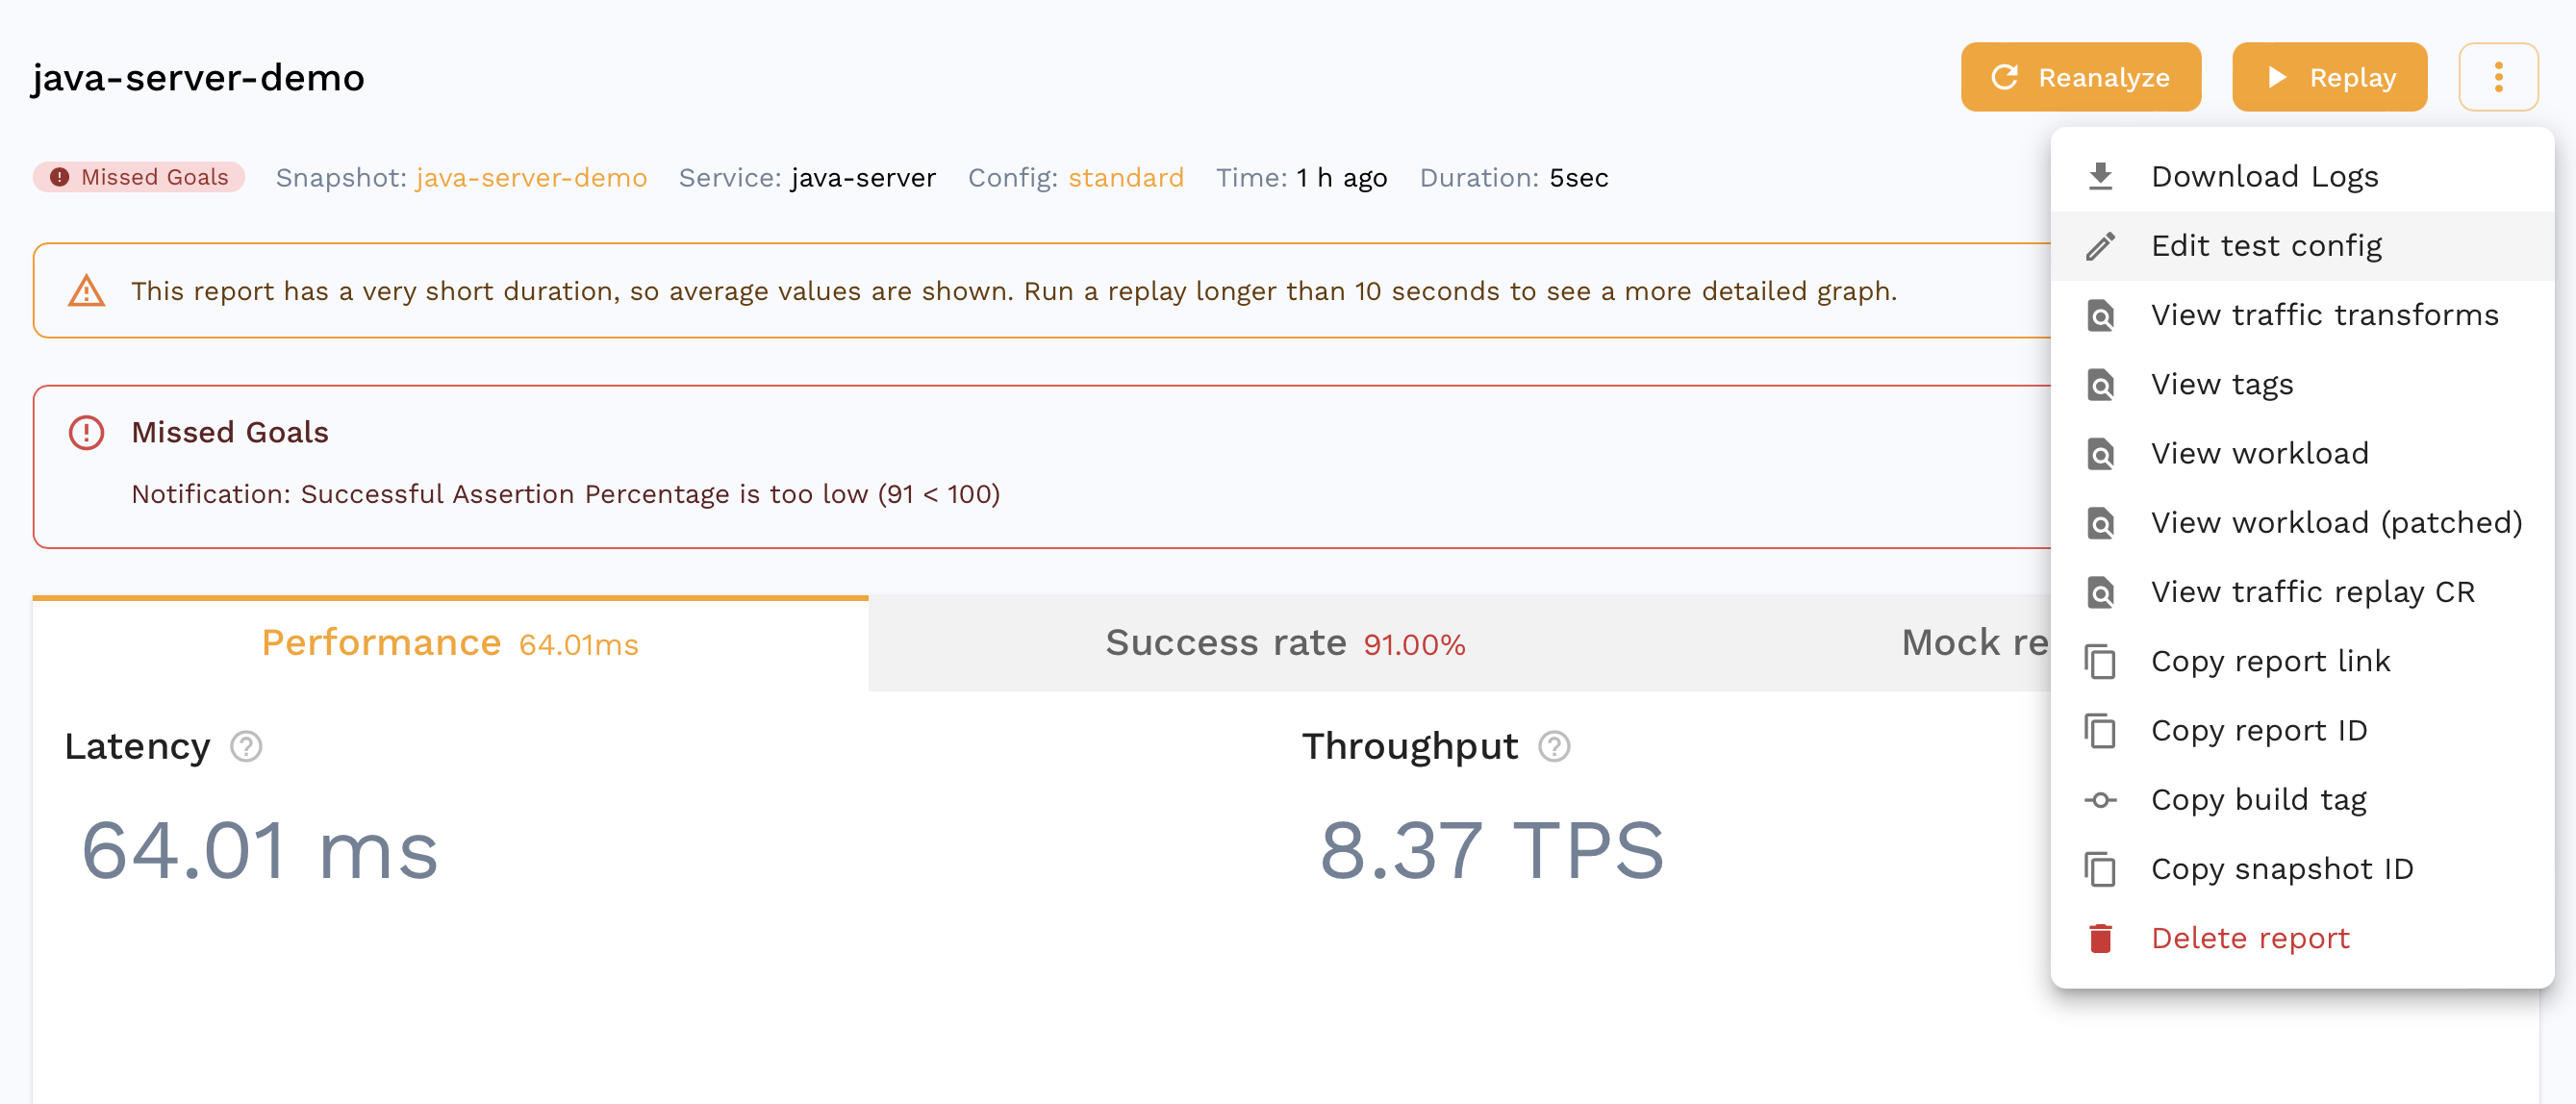
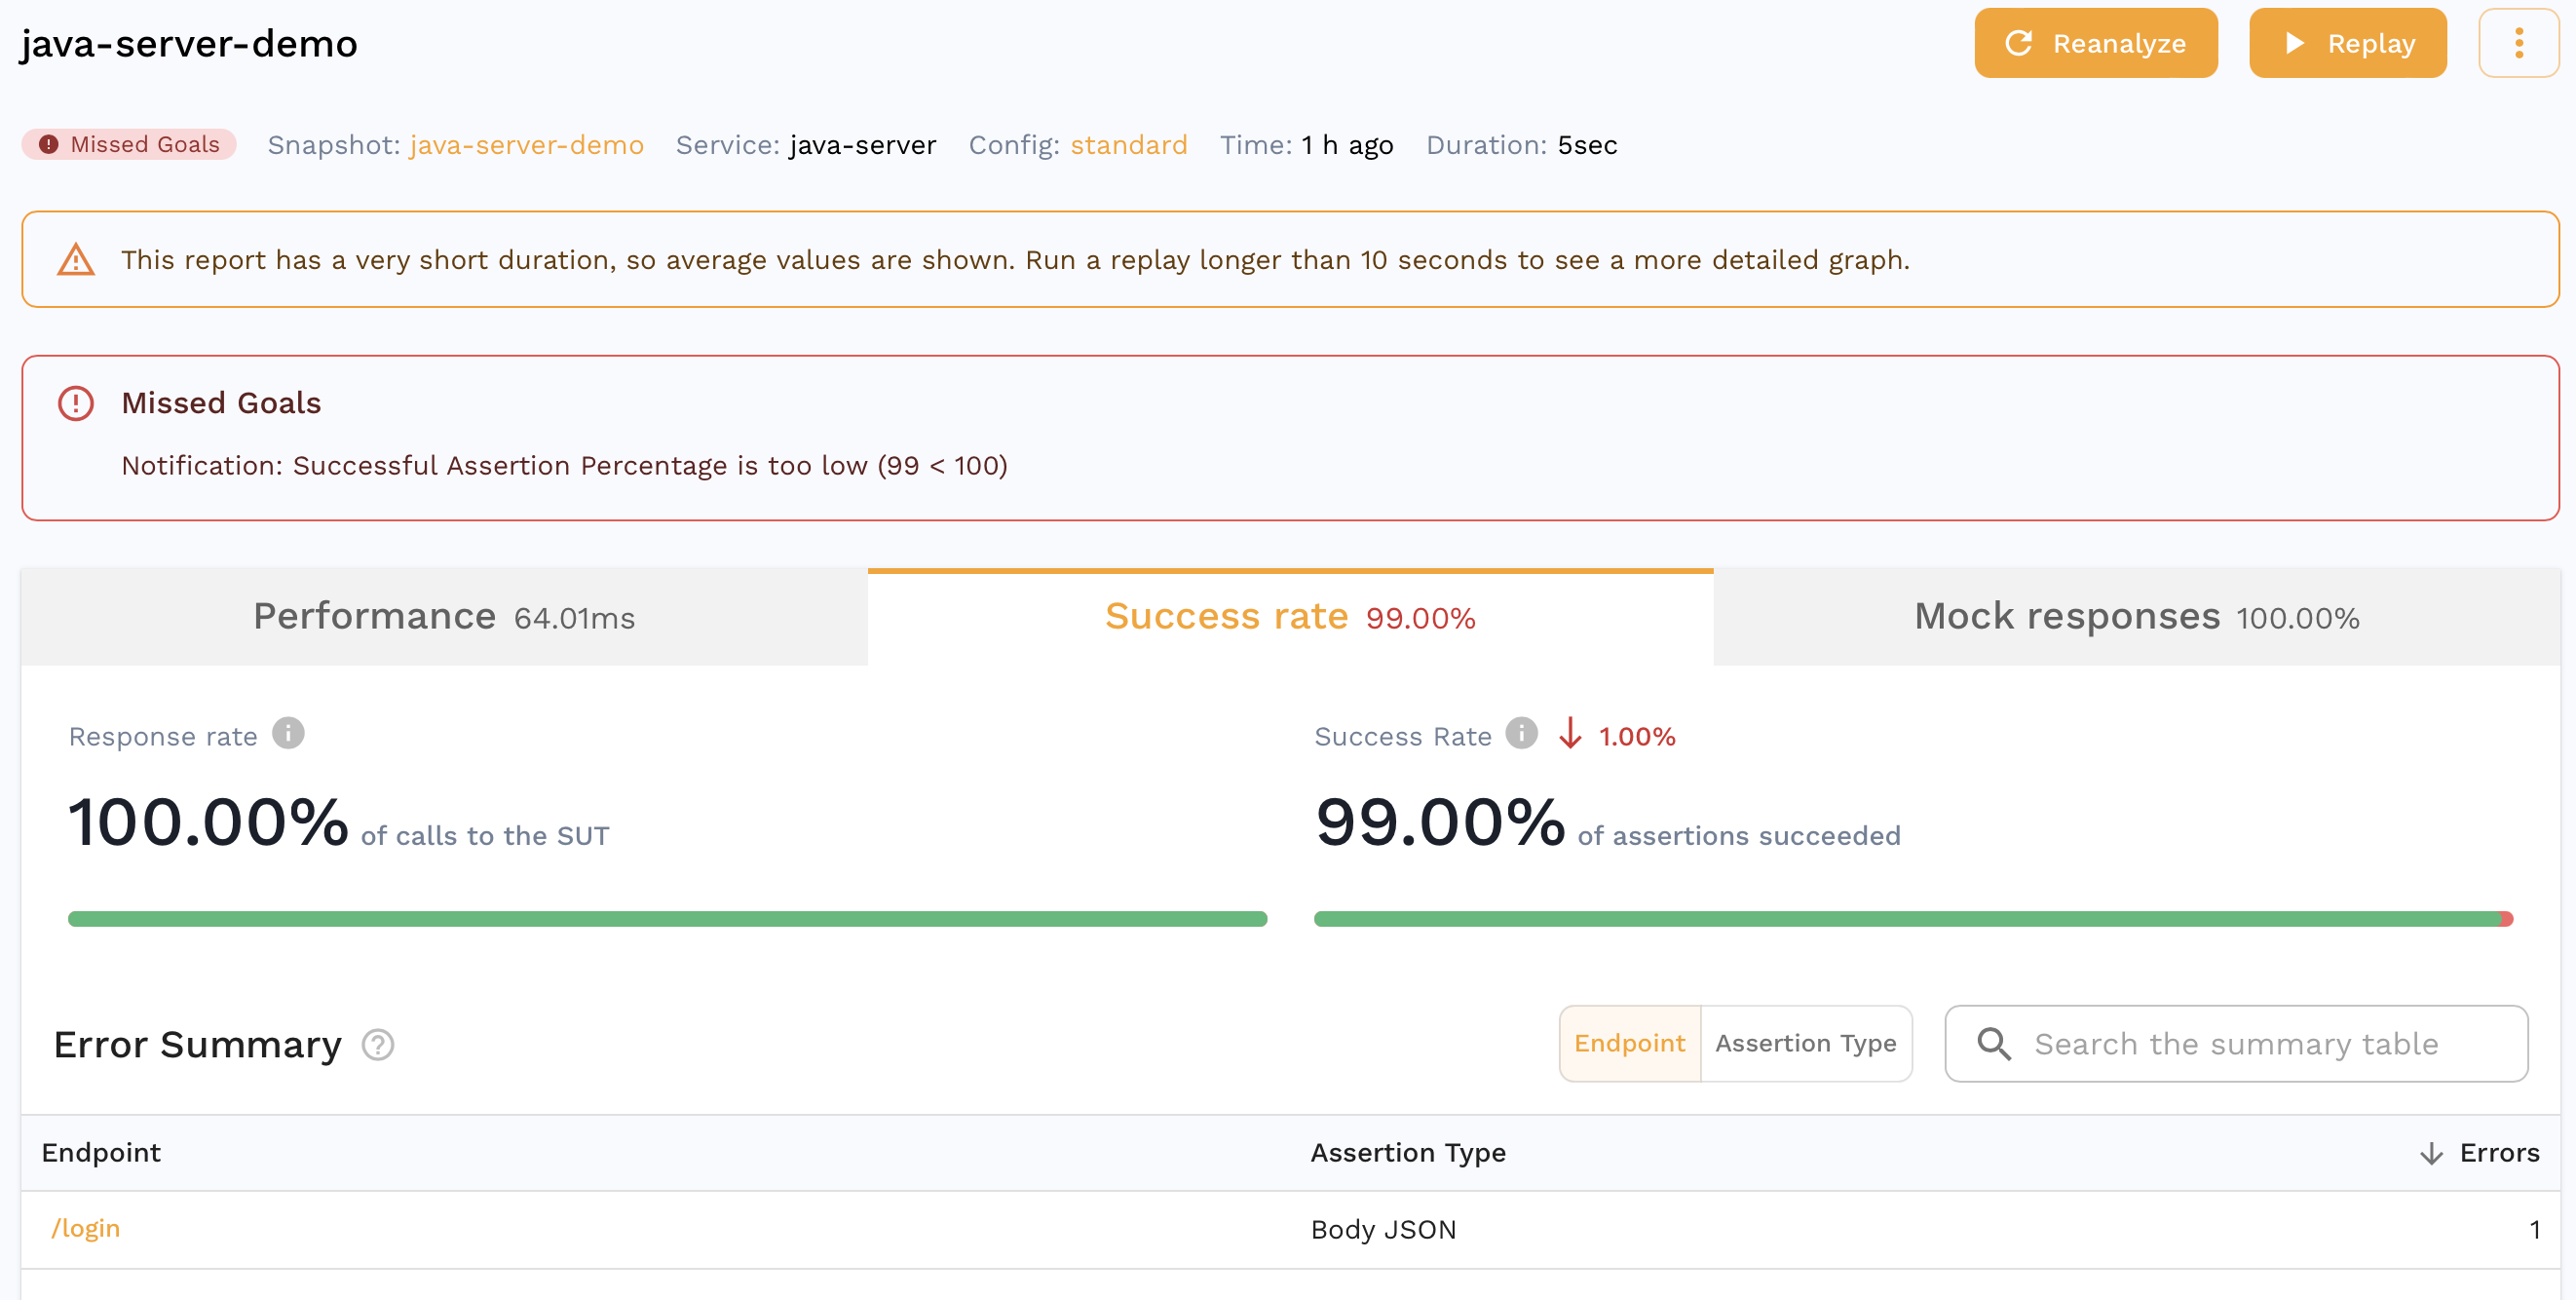
If you are already viewing the Snapshot you recorded, you can see your replay appear in the Replay tab. Alternatively, you can find a report for your Replay in the dashboard. It should look something like this.
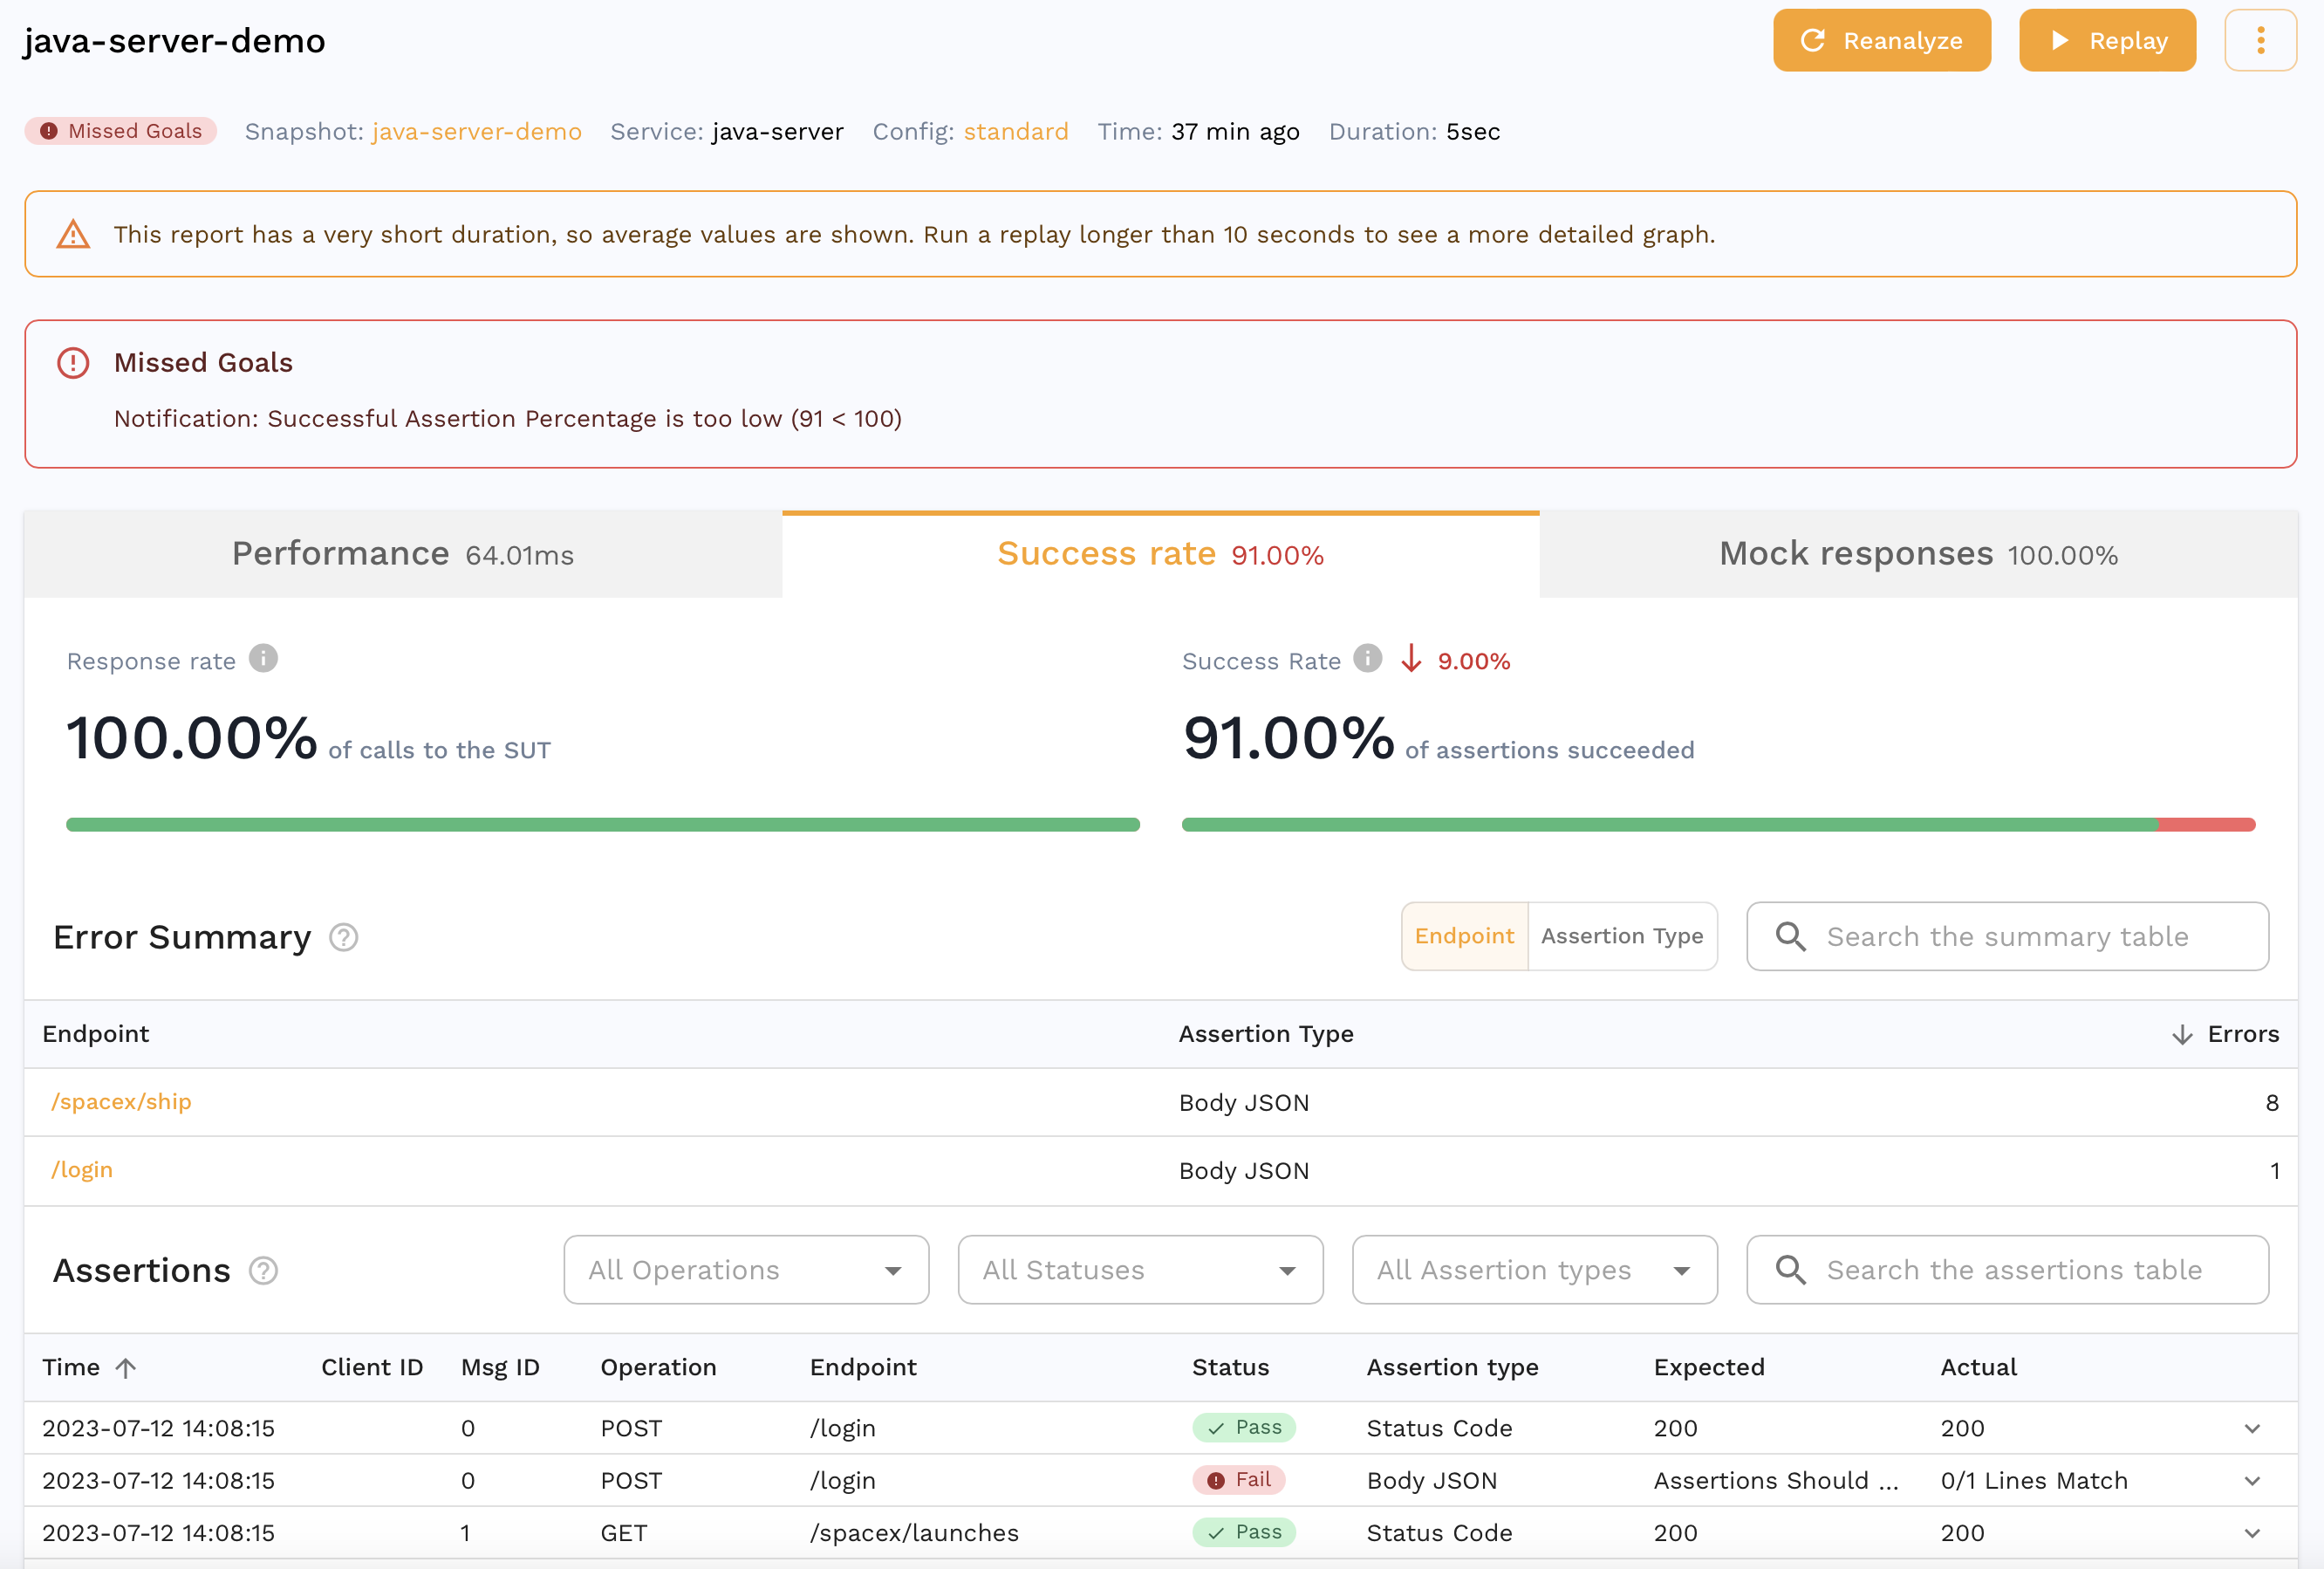
We can see that all the requests our app makes to third party APIs were mocked out with 100% accuracy. For eg. we can see the request our app made to the Treasury API that was actually mocked out which is great for isolation during tests but we can also do this for other parts of our development cycle as detailed here.
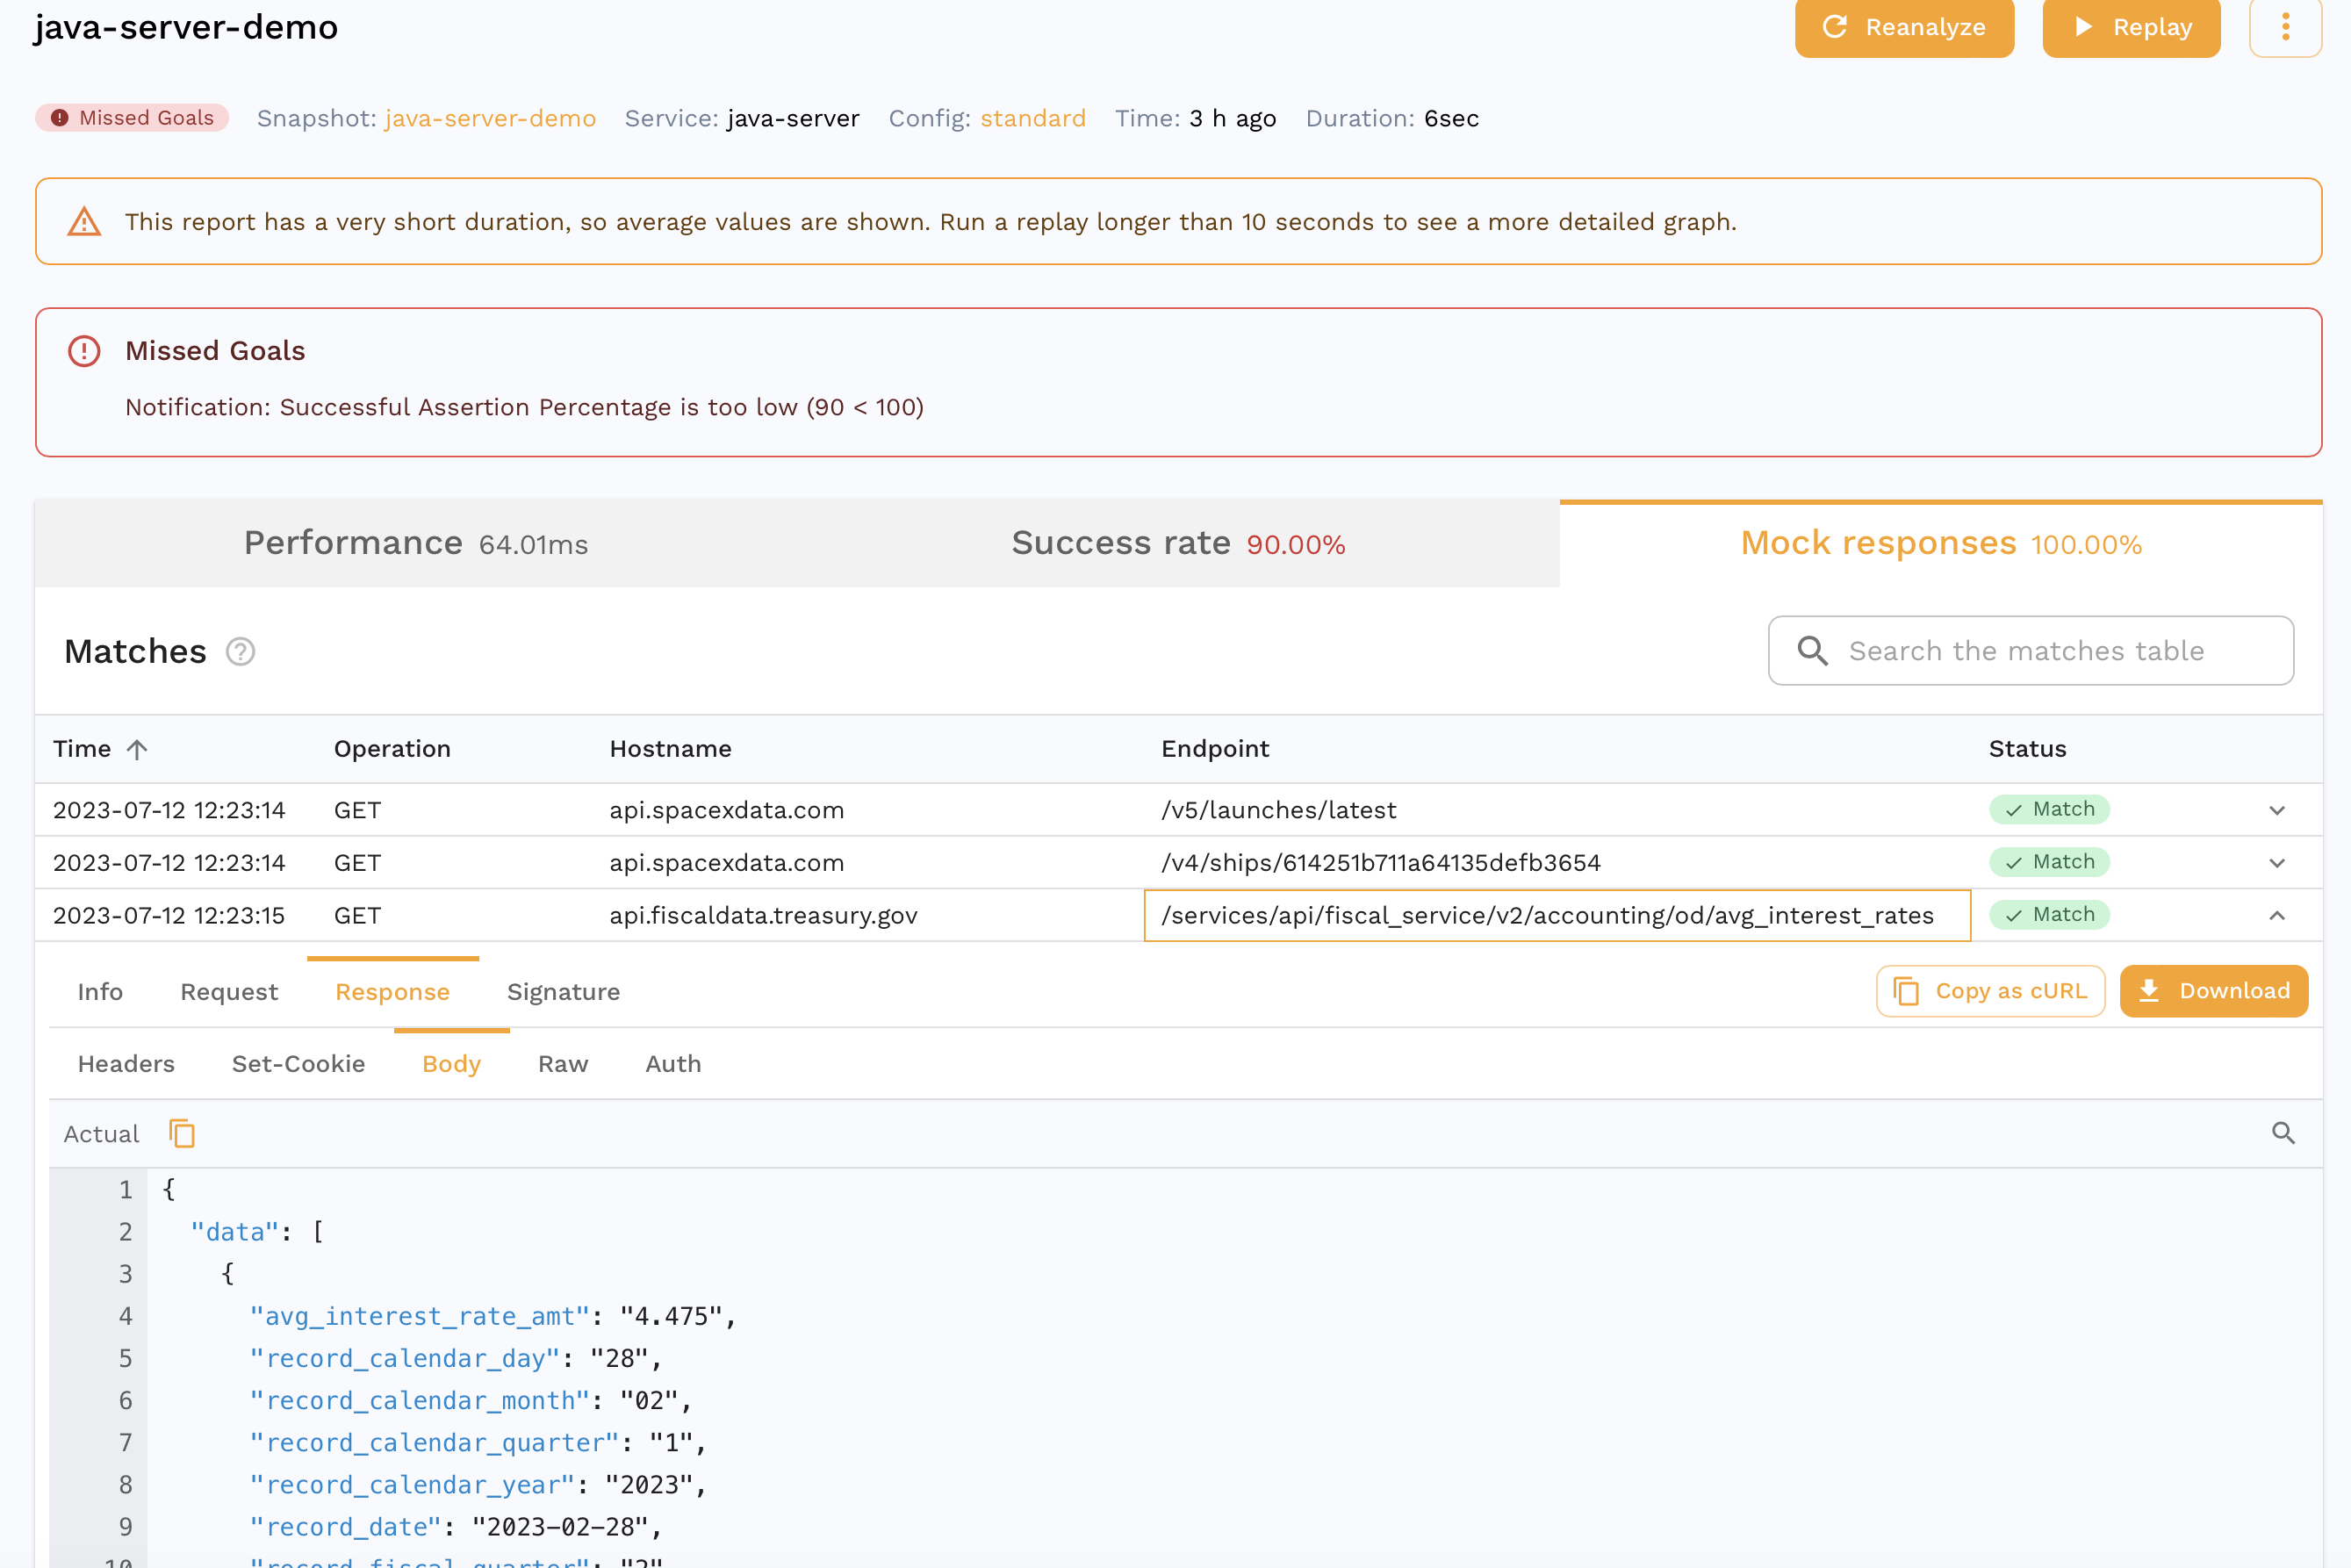
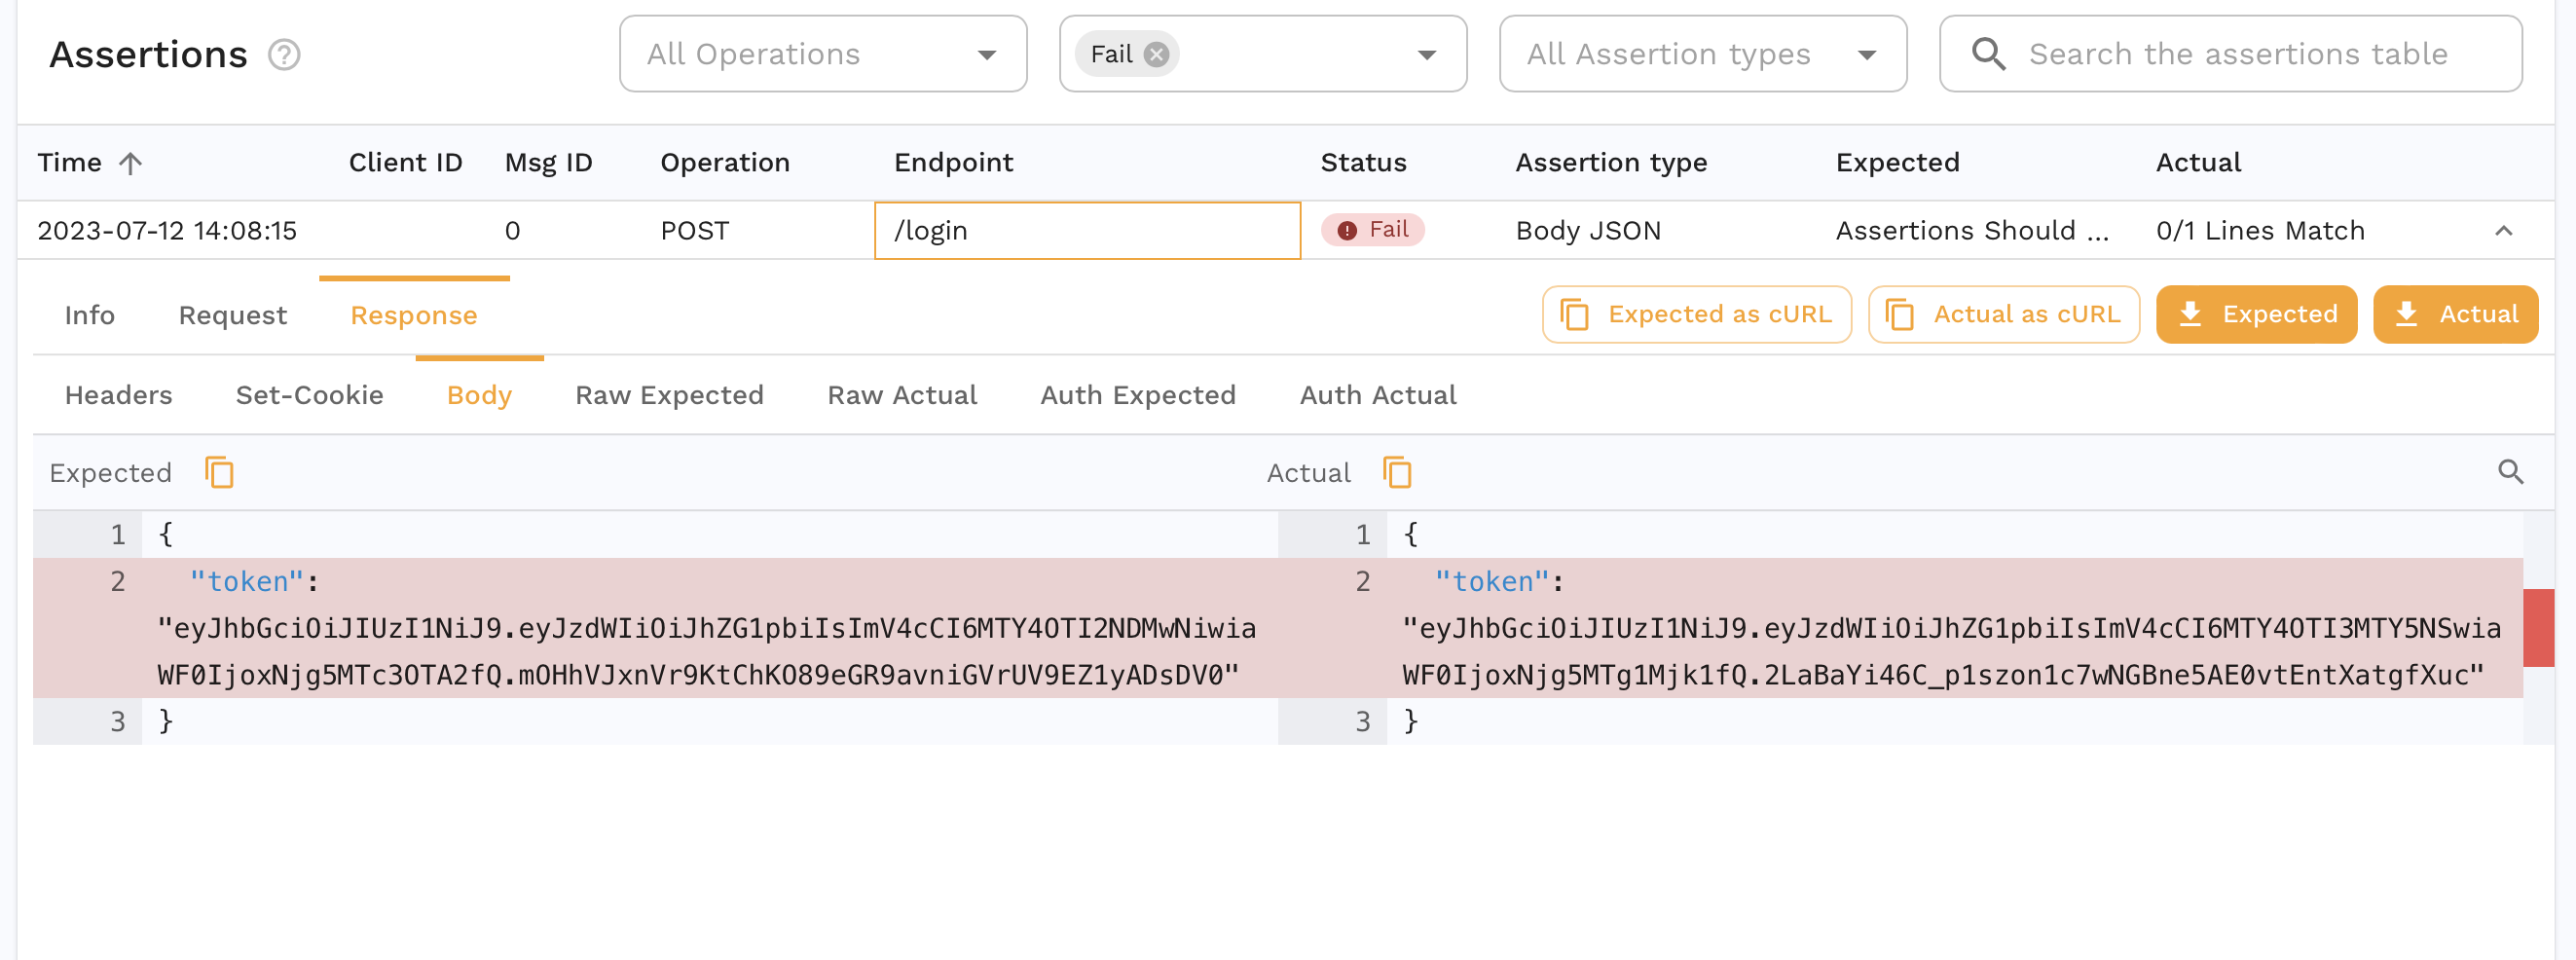
You can also see that the accuracy isn't 100%. We can drill down into a specific assertion to see why.
Transform
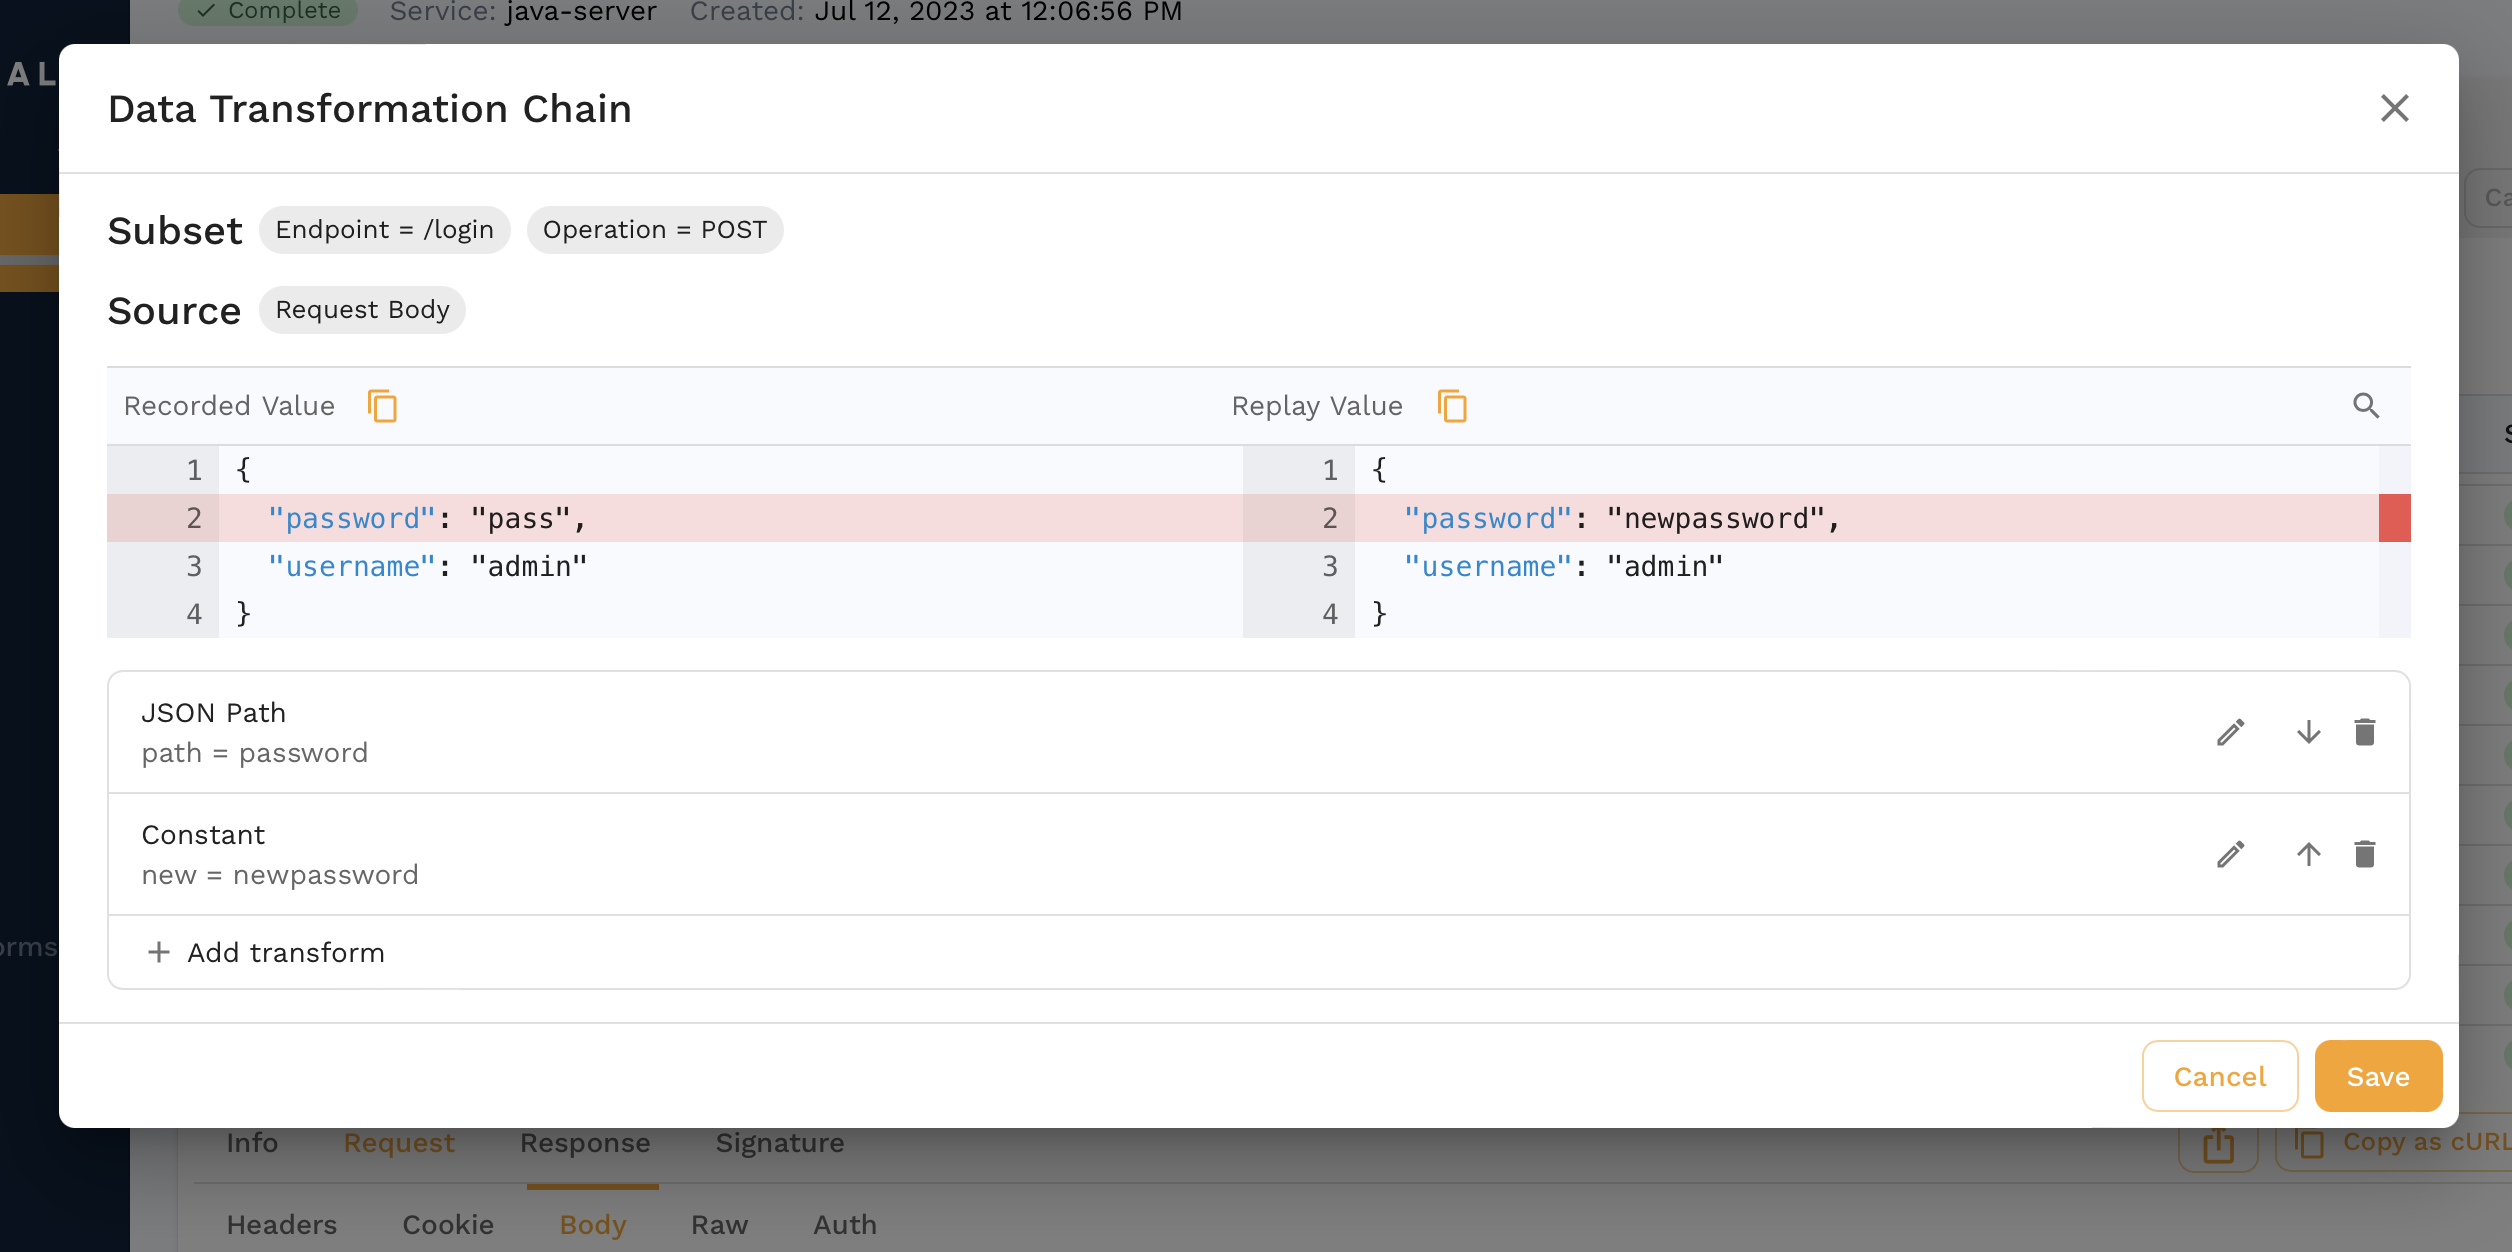
The JWT we get from the login request is different which is expected. If we were replaying in a different environment, we might need different credentials entirely for the login request. Another pattern might be a set of traffic where we don't have a login request and instead we need to resign the JWT from our captured traffic. This is where Transforms come into play and we can edit our captured data to parameterize parts of it. As an example, we can transform our snapshot to edit the password.
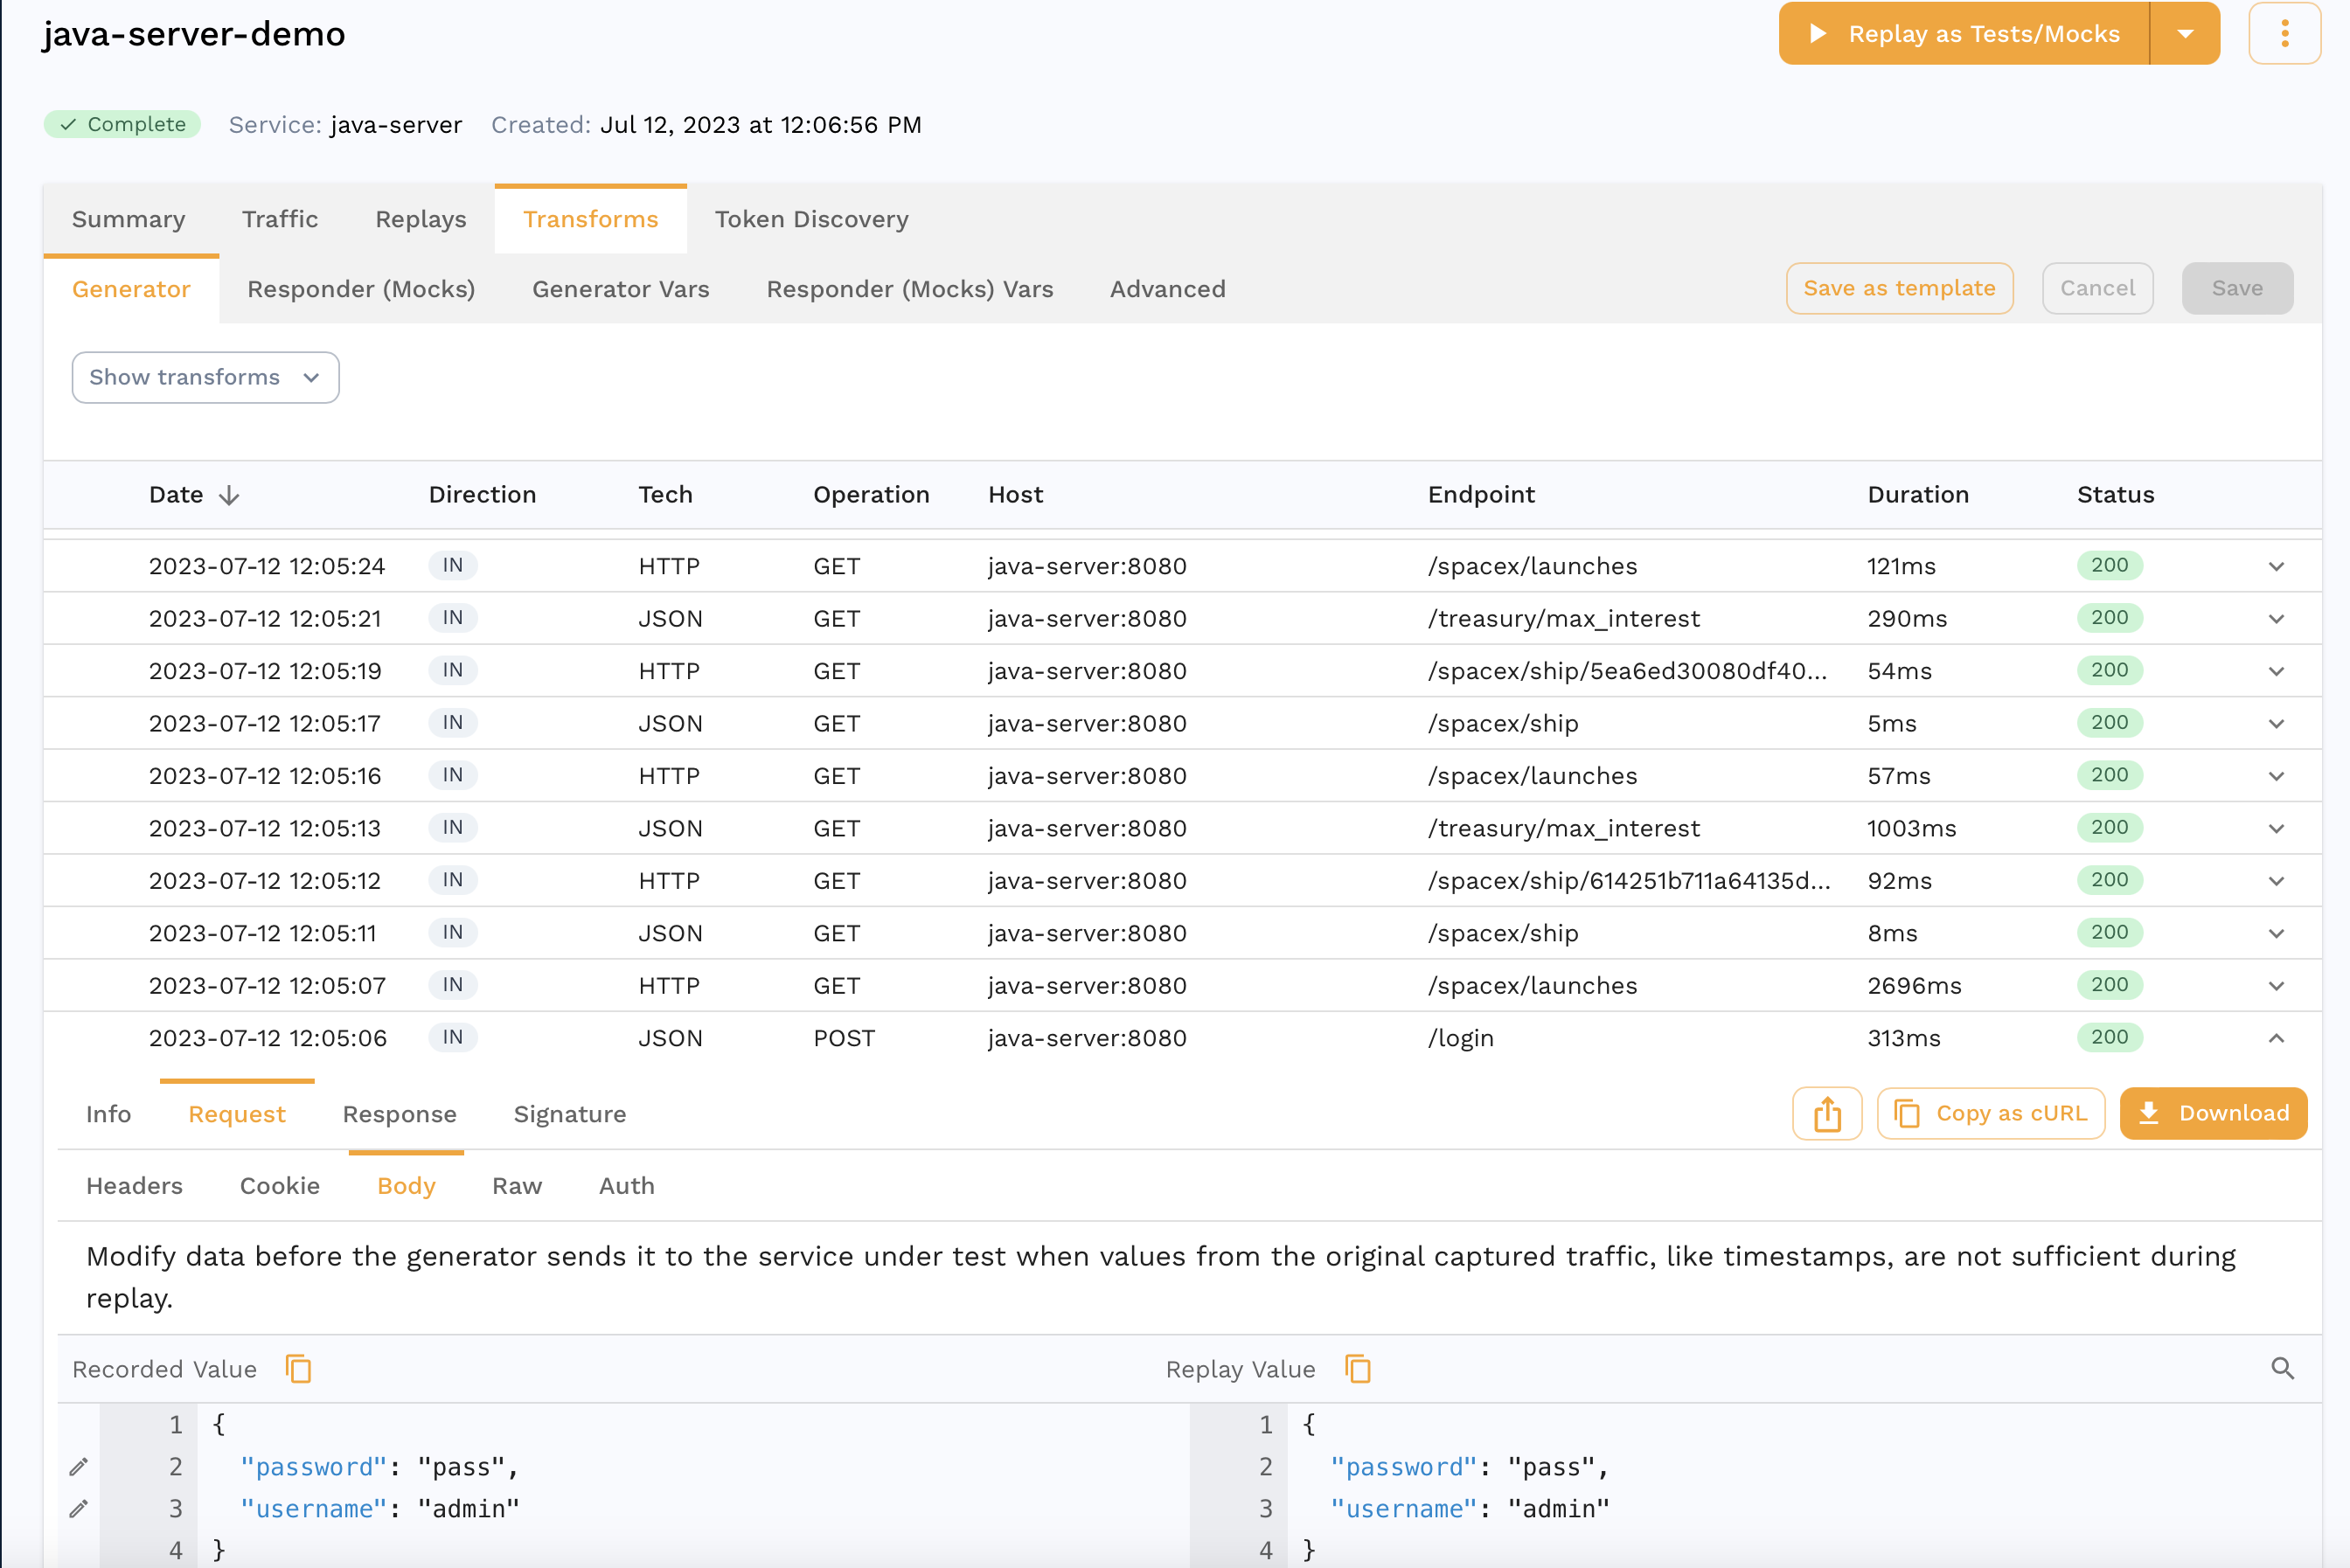
When you find the request in the transform editor, you can click the pencil icon next to the field you want to edit which in our case is the password.
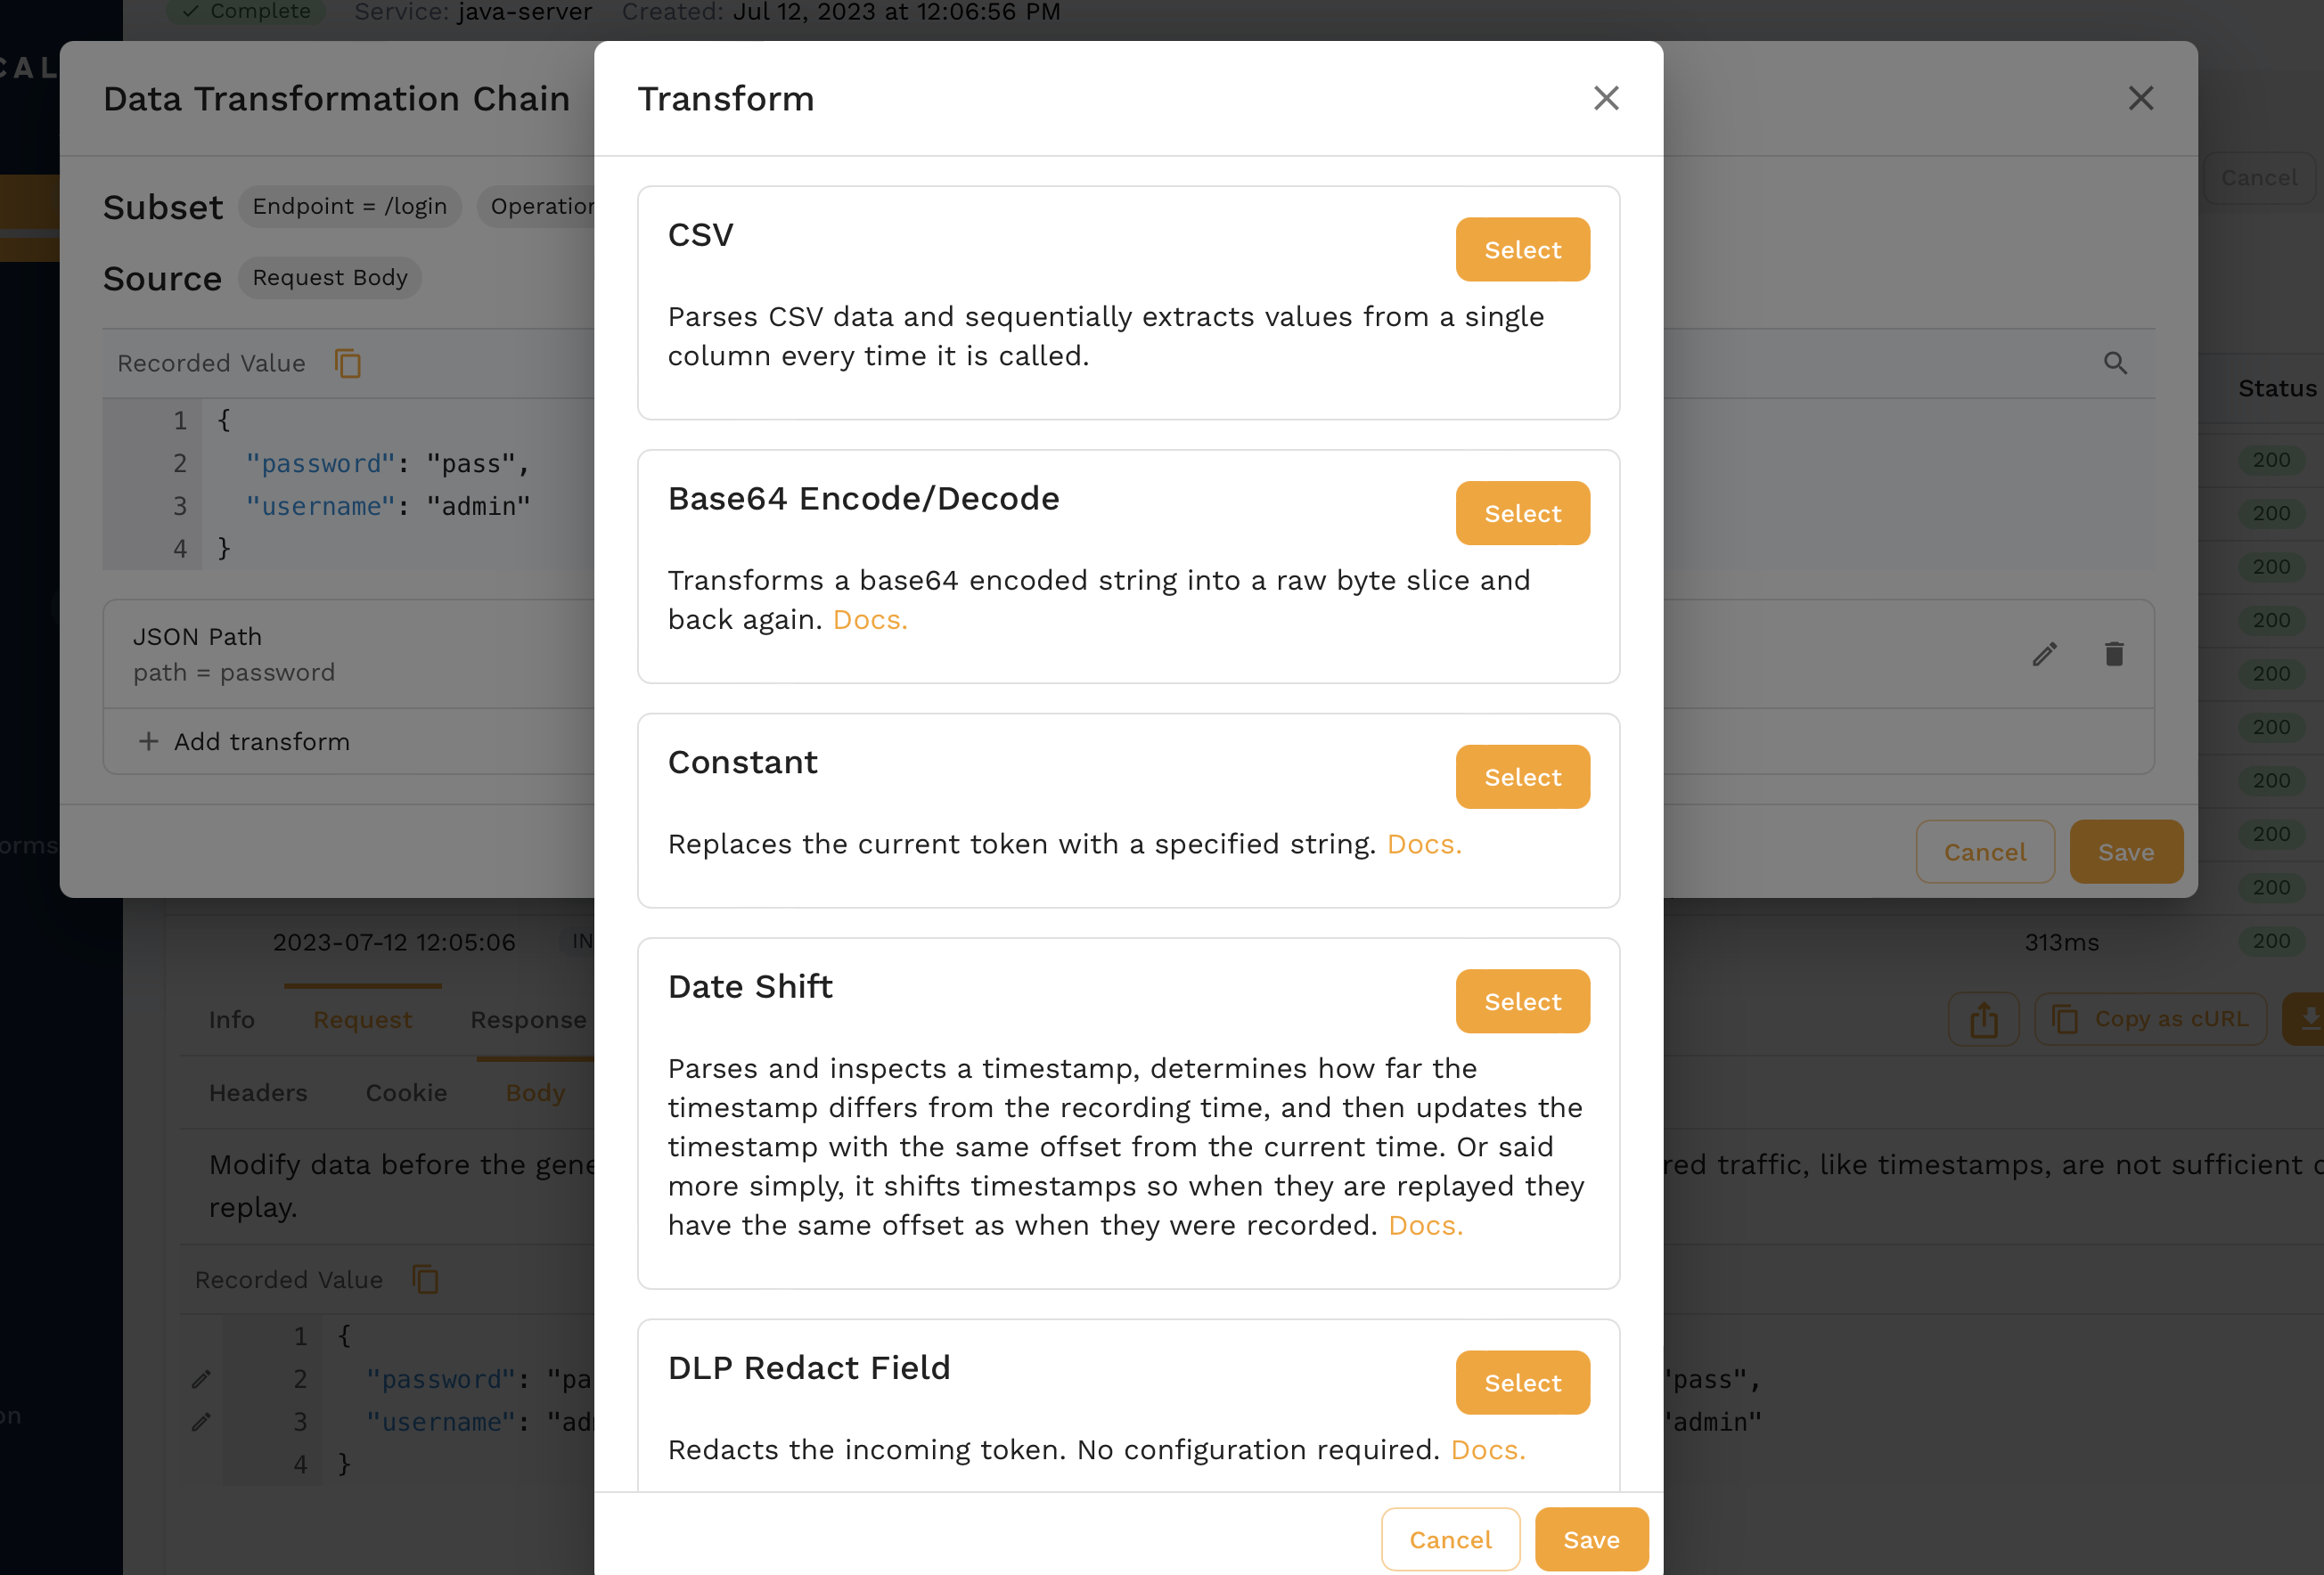
For now we'll just replace it with a constant but there are all sorts of options that can be chained together.
We just did a transform for the traffic coming into our app during a replay. We can also use transforms for mocks in case we have to parameterize fields like session ids, dates, etc. Check out this guide for a deep dive.
Assertions
Another assertion that failed in our report is for the /spacex/ship endpoint.
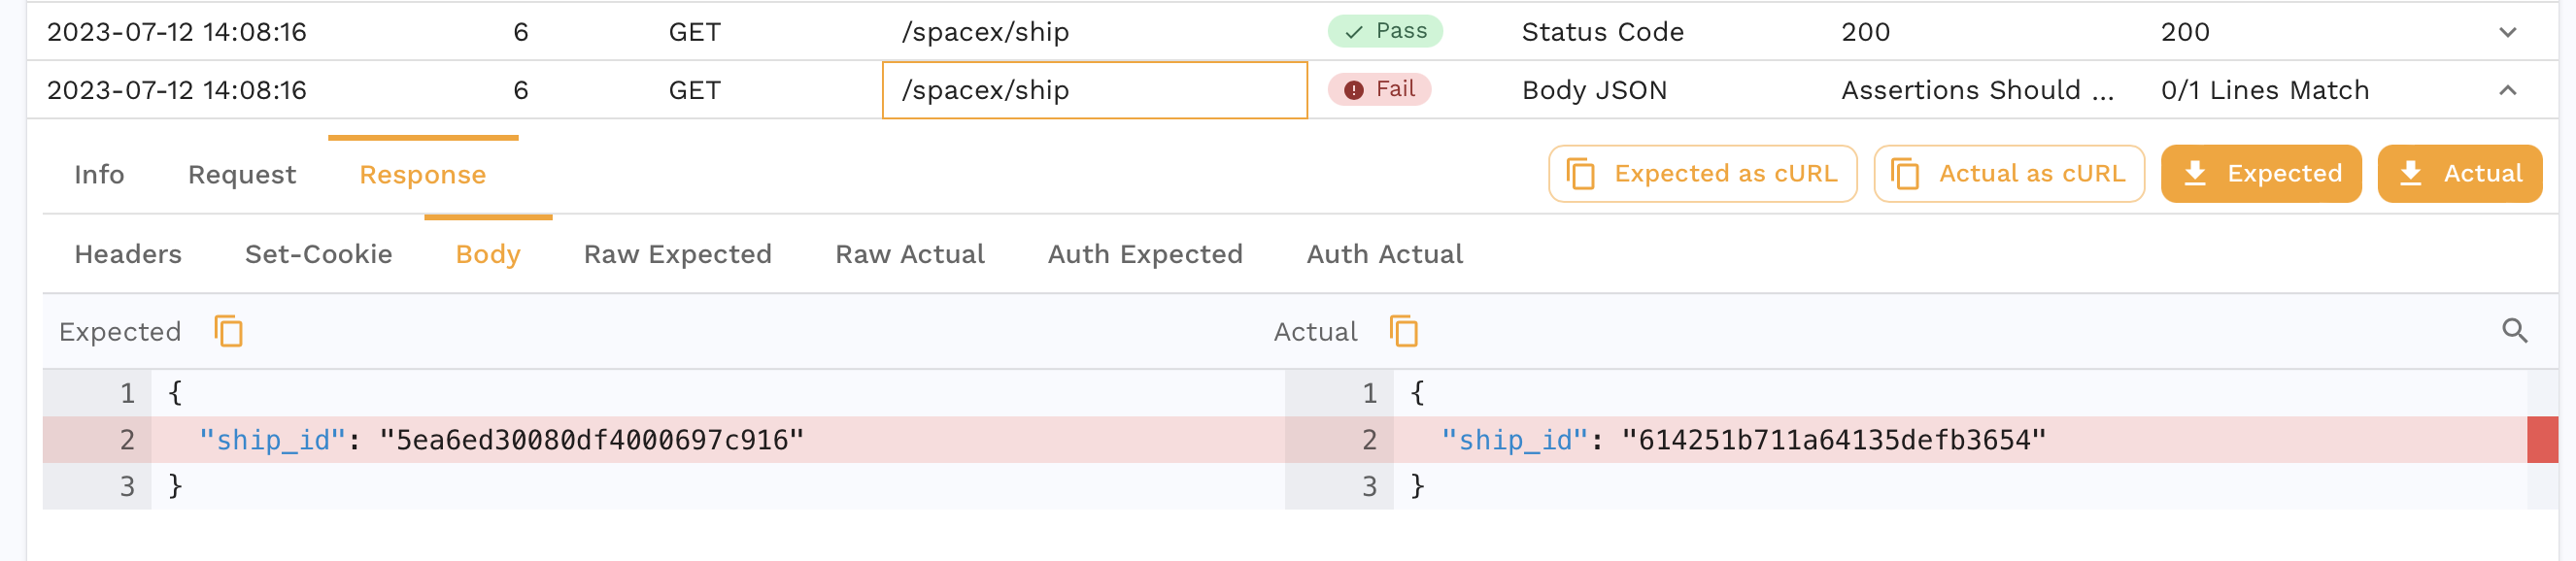
Our app returns a different ship ID every time we make a request so this is an expected failure. We can edit the test config for our Report to account for this.
Click the pencil next to the HTTP Response Body assertion and we can add ship_id as a json path to ignore.
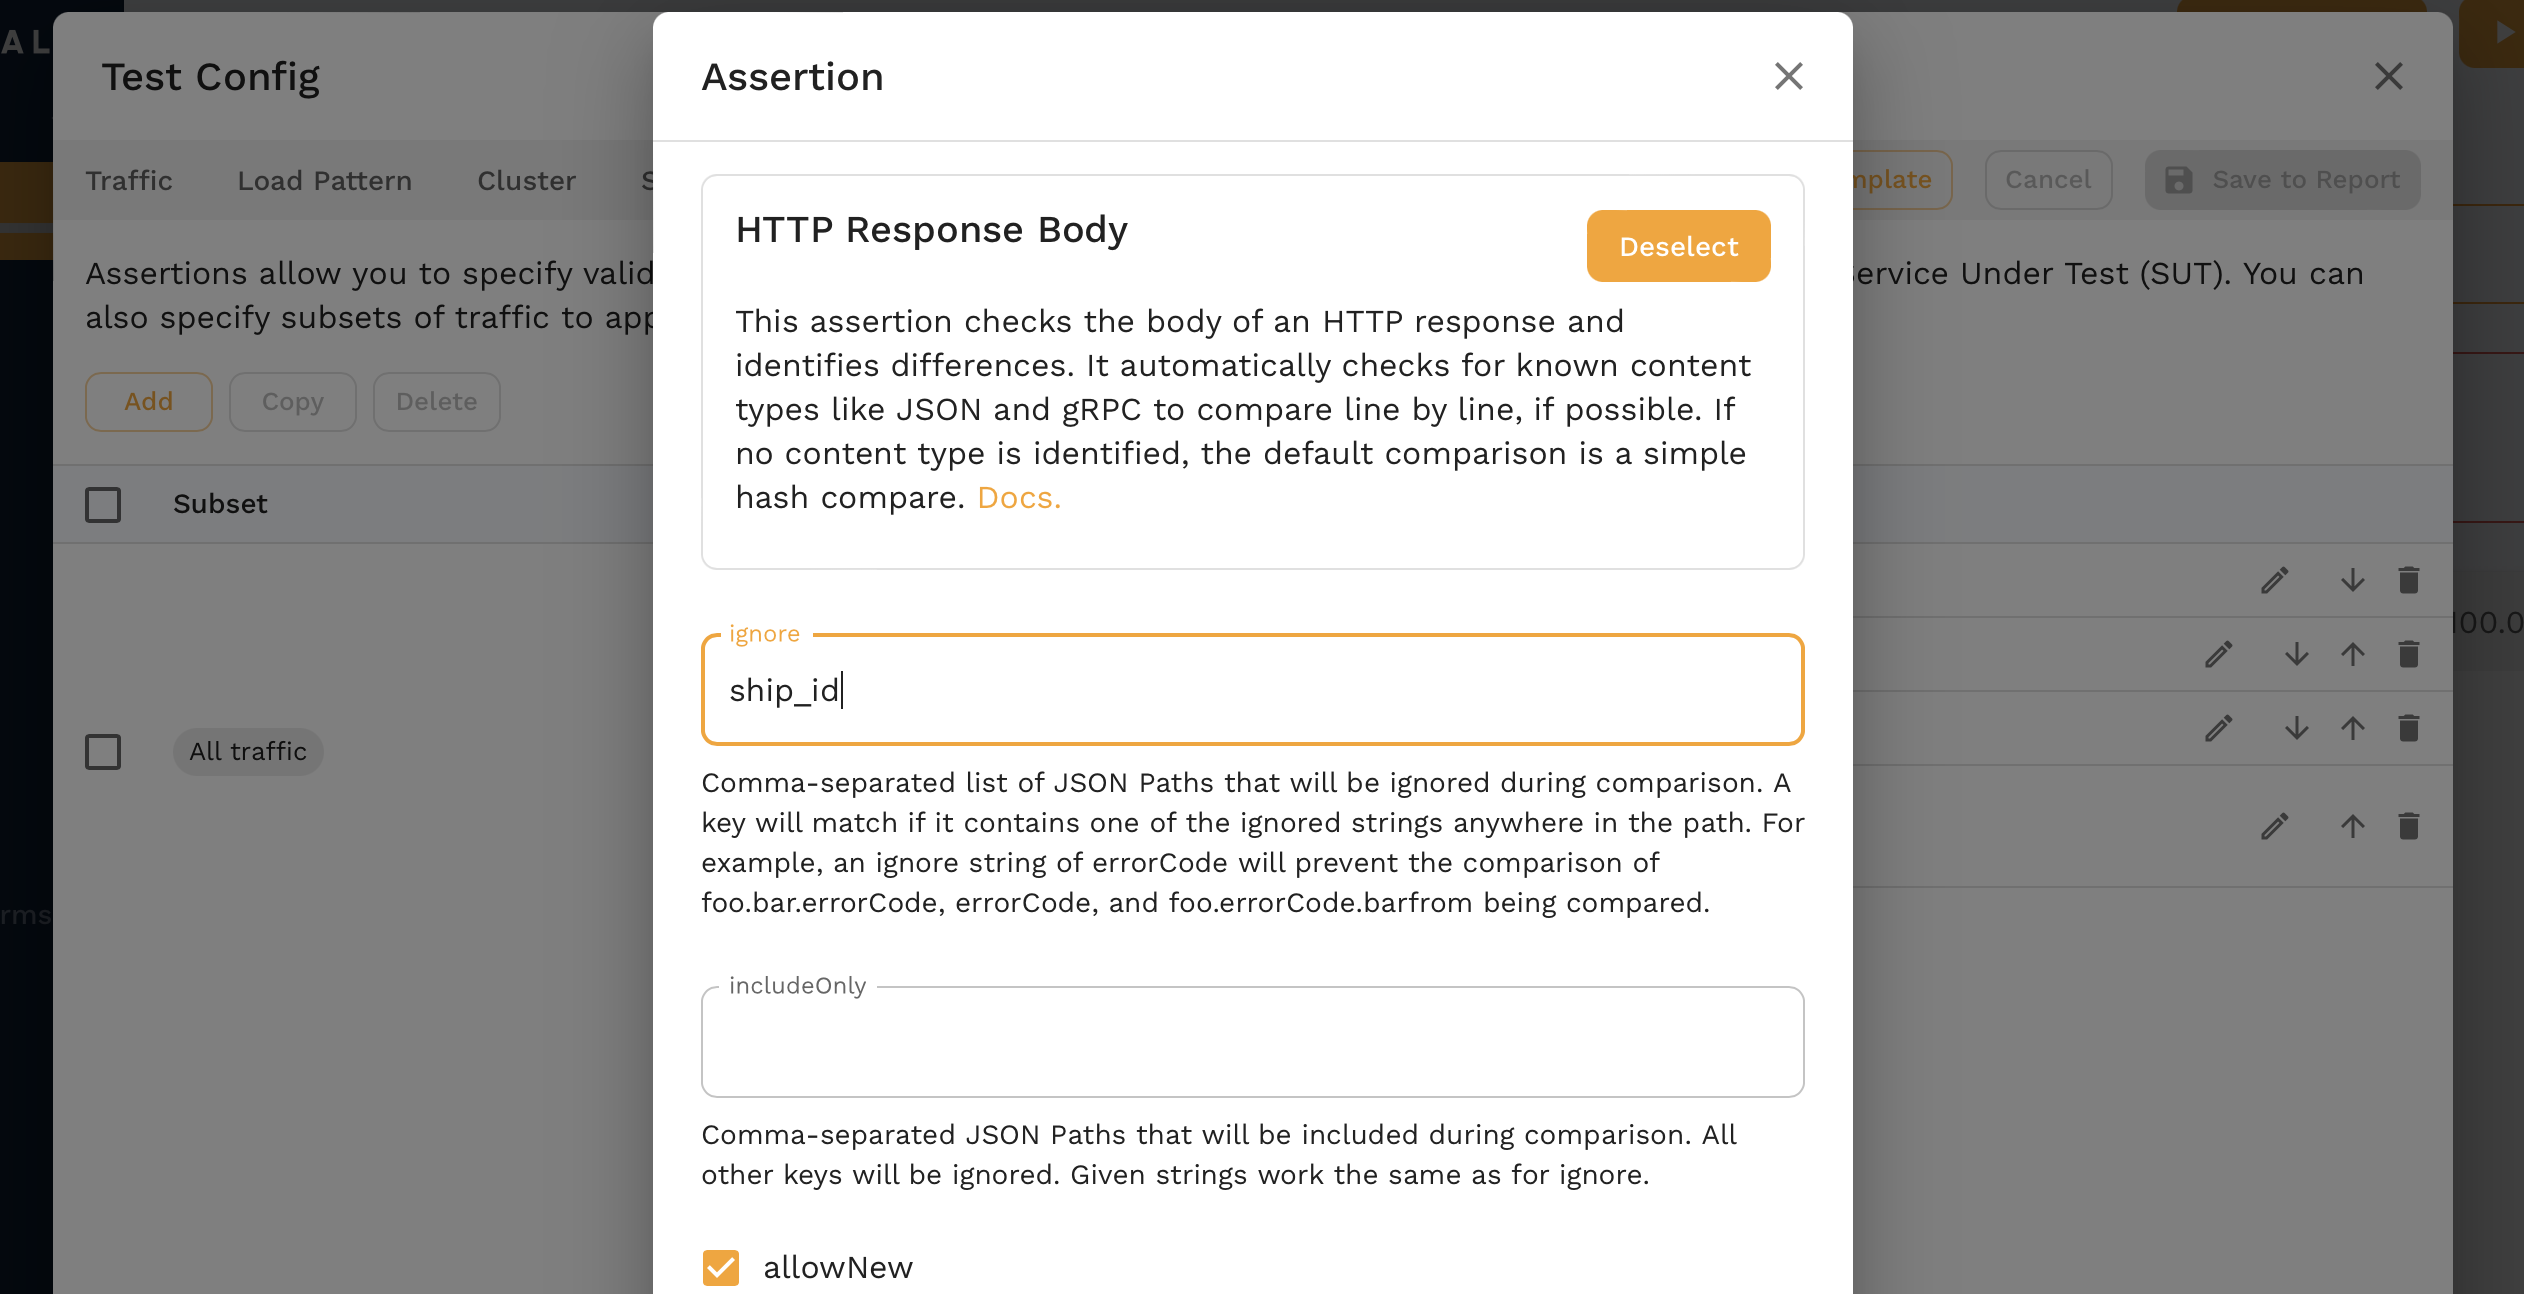
After saving, we can reanalyze the report and we see much better results!
Overview
In this demo we:
- Captured some traffic
- Analyzed it in the Traffic Viewer
- Optionally configured DLP
- Ran a replay and created a snapshot
- Used auto generated mocks during the replay
- Transformed some snapshot traffic
- Edited the assertions
- Reanalyzed the report for a higher accuracy
Next Steps
This is just a small subset of things you can do with Speedscale, other things to try out could be:
- Capture traffic from one of your own apps
- Replay traffic from one cluster into another
- Run a load test
- Integrate with CI/CD
Uninstall
If you'd like to remove the demo from your environment follow these instructions:
- Kubernetes
- Docker
make kube-clean
docker compose -f speedscale-docker-capture.yaml down
(Optional) Data loss Protection
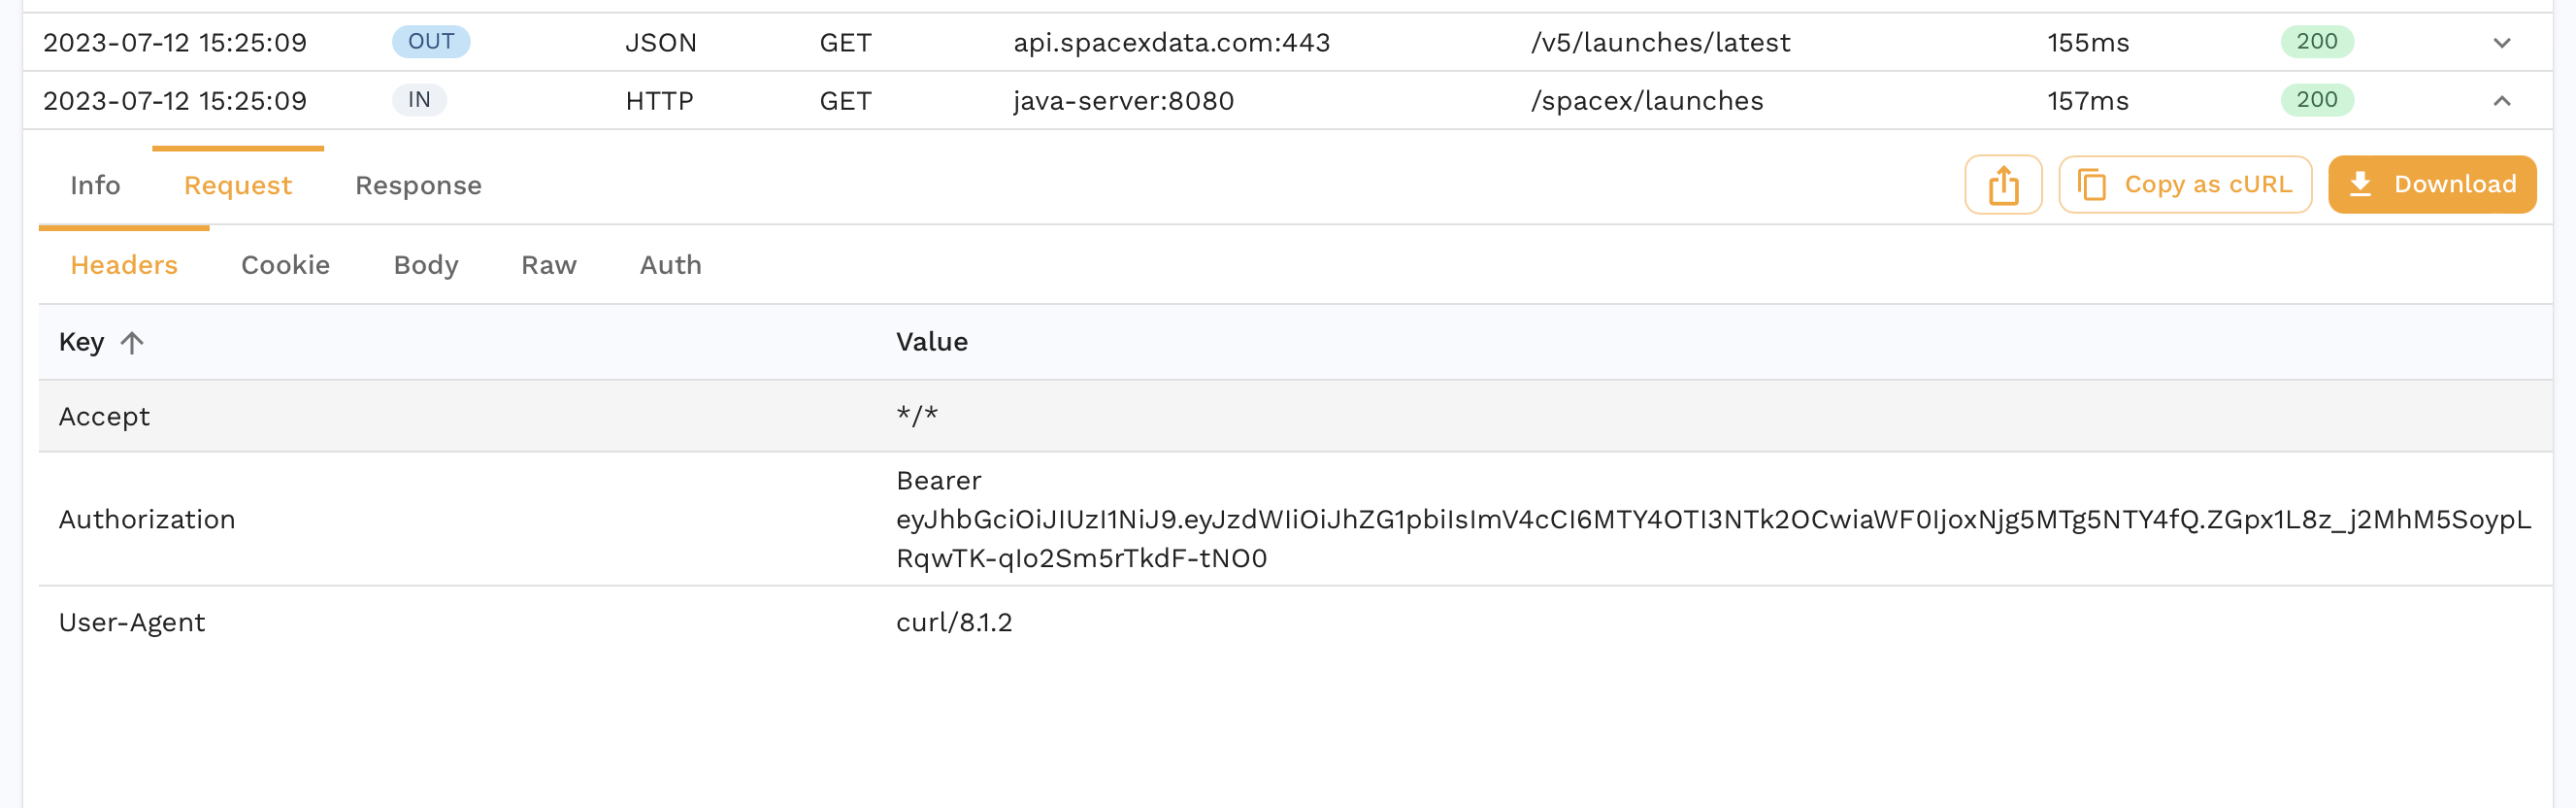
If we drill down into a request, we can also see data we may not want to leave our environment.
You can enable DLP to redact certain fields from an RRPair at capture time. Note that this will cause your replays to have low accuracies because necessary information will be masked. Check out the dlp section for more information on DLP configuration. As a starter, you can follow the instructions below.
- Kubernetes
- Docker
- Local
Run:
speedctl infra dlp enable
Edit speedscale-docker-capture.yaml to add the following two environment variables.
services:
  forwarder:
    environment:
      - SPEEDSCALE_REDACT=true
      - SPEEDSCALE_DLP_CONFIG=standard
When running proxymock the files are stored locally but don't run through data loss prevention.
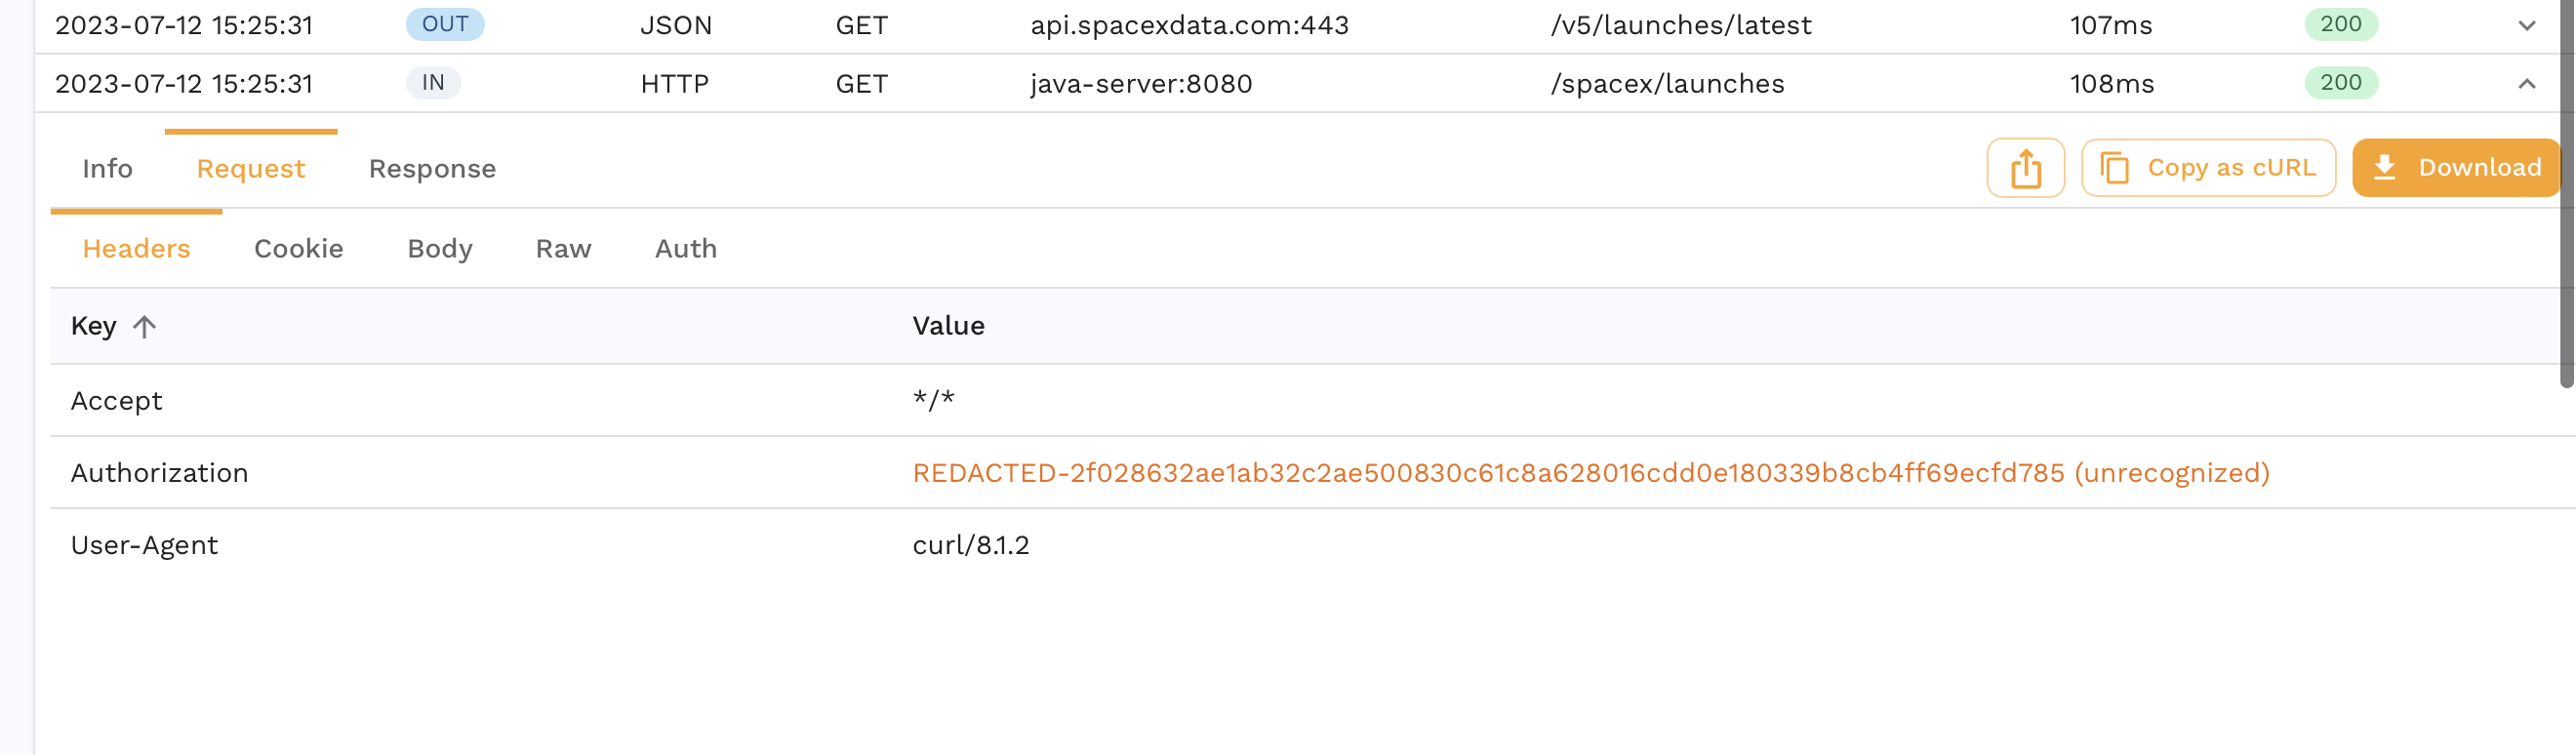
Now we see the authorization header is redacted and never makes it to Speedscale.
For more complex DLP configuration you can use this guide.