Generator Sizing Guide
When running a load test it is helpful to understand the environmental requirements for reaching your desired throughput. After all, setting a target of 20,000 RPS in your test config won't be enough if the load generator only has 1 CPU to work with.
Load tests in Speedscale are driven by the generator, a process that sends requests to your service as fast as possible. This guide will help you understand the factors that can affect generator throughput and setup your environment accordingly.
Factors Affecting Throughput
- The largest factor in generator throughput is available CPU. The generator is CPU bound so more CPU will almost always mean higher potential throughput. See sections below for specific information.
Latency calculation is no longer reliable once the generator is using at or close to 100% CPU so it is critical to ensure some headroom.
-
The second largest factor is the SUT, your application. Given the same available CPU an application with an average response latency of 100ms will achieve higher throughput than one with 500ms.
-
Lastly, transforms may also affect throughput. The combination of captured traffic and transforms are what make Speedscale unique and powerful, but they also come with a performance cost which depends on the transform being used. Resigning JWTs, for example can be a compute intensive operation and often affects every RRPair in a snapshot. While transforms generally don't account for a majority of the generator's CPU time, any processing dedicated to transforming traffic cannot be used to send requests and process results.
Observed Throughput
While every application is unique, observations of throughput under different hardware configurations can be helpful with initial resource allocation.
The table below contains observations made while running a replay on servers with various resources. It shows the number of (virtual) CPUs available to the generator, the maximum observed RPS, and the number of concurrent vUsers when that throughput was observed. The SUT latency was a fixed 100ms for all requests and the observation was taken when increasing the vUser count no longer yielded higher RPS.
| CPU Cores | Observed RPS | vUsers |
|---|---|---|
| 2 | 800 | 100 |
| 4 | 3,300 | 400 |
| 8 | 8,000 | 1,100 |
| 16 | 16,000 | 2,500 |
| 30 | 30,000 | 3,600 |
| 60 | 45,000 | 5,000 |
Contact Speedscale support for solutions that scale beyond the observed RPS seen here.
Configuration
Load tests should always set the test config to run with low data mode enabled to avoid sending thousands or millions of RRPairs to the Speedscale cloud. If the load is high enough the generator will generate requests, and thus RRPairs, faster than they can be captured. This can result in the generator running out of memory and crashing as it tries to process them all. For the same reason avoid setting the log level higher than "info" during load tests to avoid flooding the logs with millions of events which could also cause the generator to crash.
If you are looking to achieve the highest throughput possible you should define load patterns with vUsers as opposed to setting a desired number of RPS. This is because the RPS strategy creates artificial delays in between requests in order to hold a desired throughput. While this process is optimized you may experience up to 10% higher throughput using vUsers instead of RPS.
See load patterns for suggestions on simulating specific load patterns.
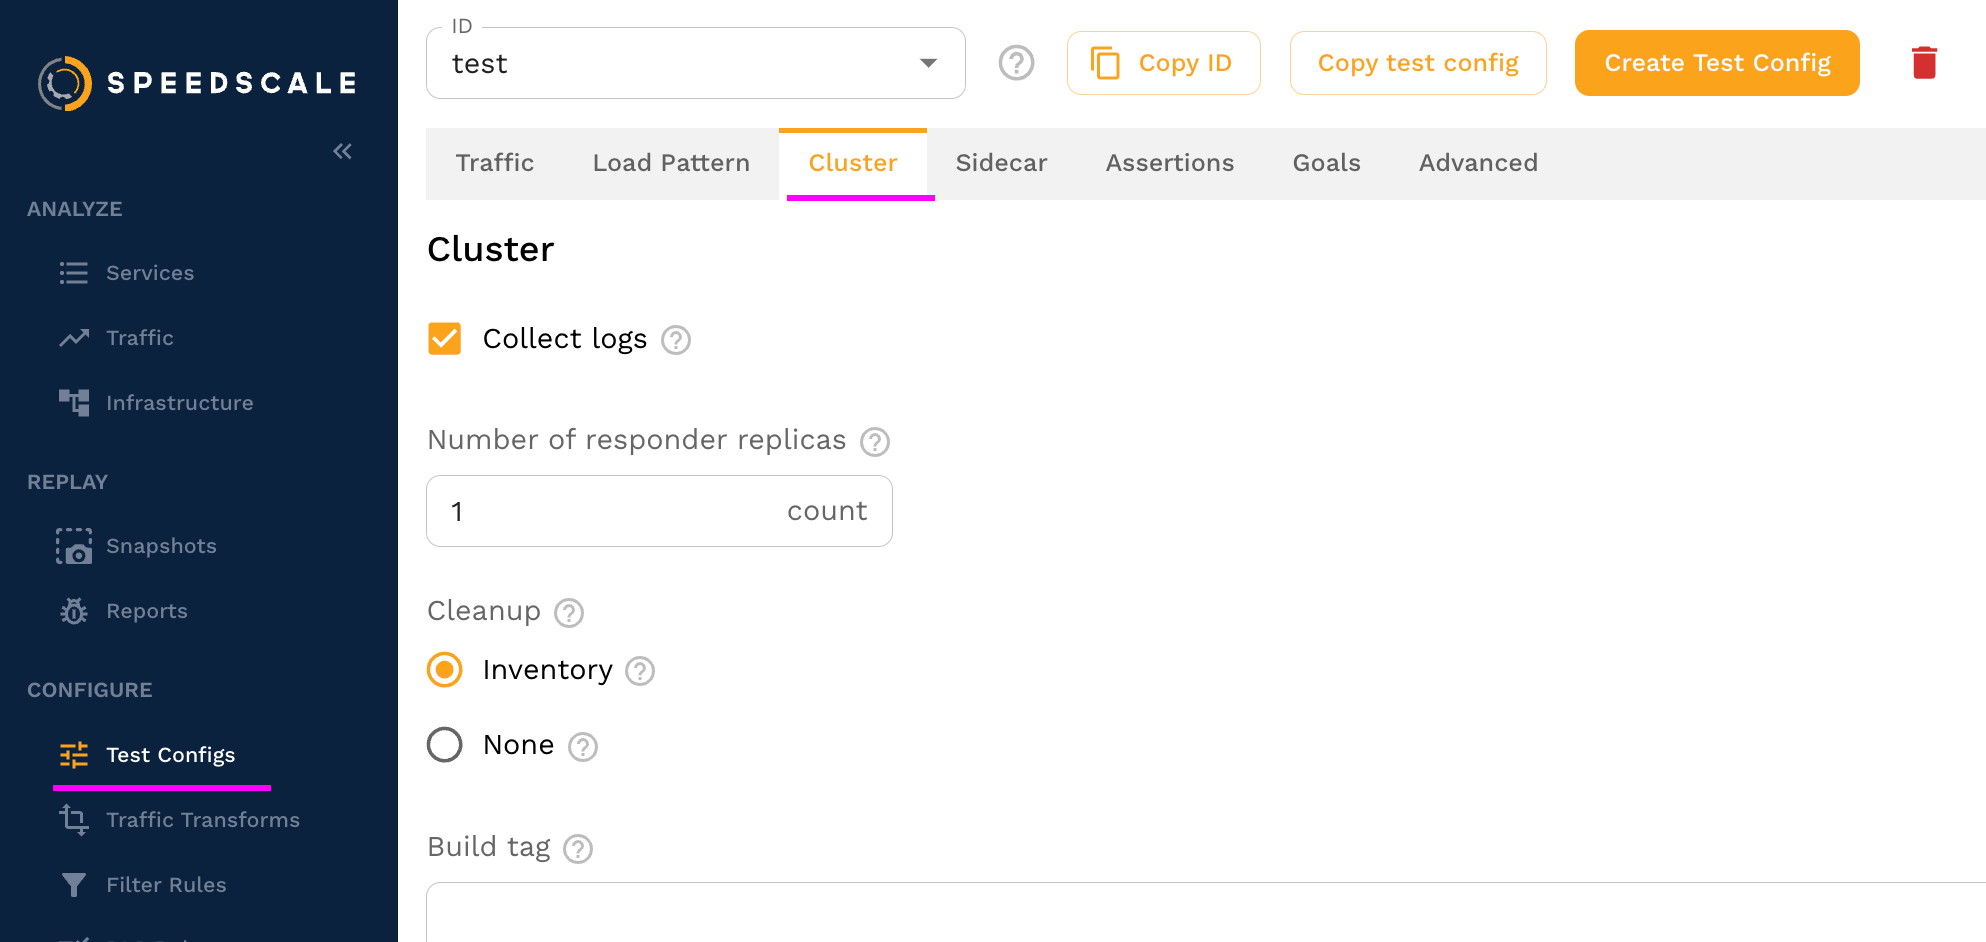
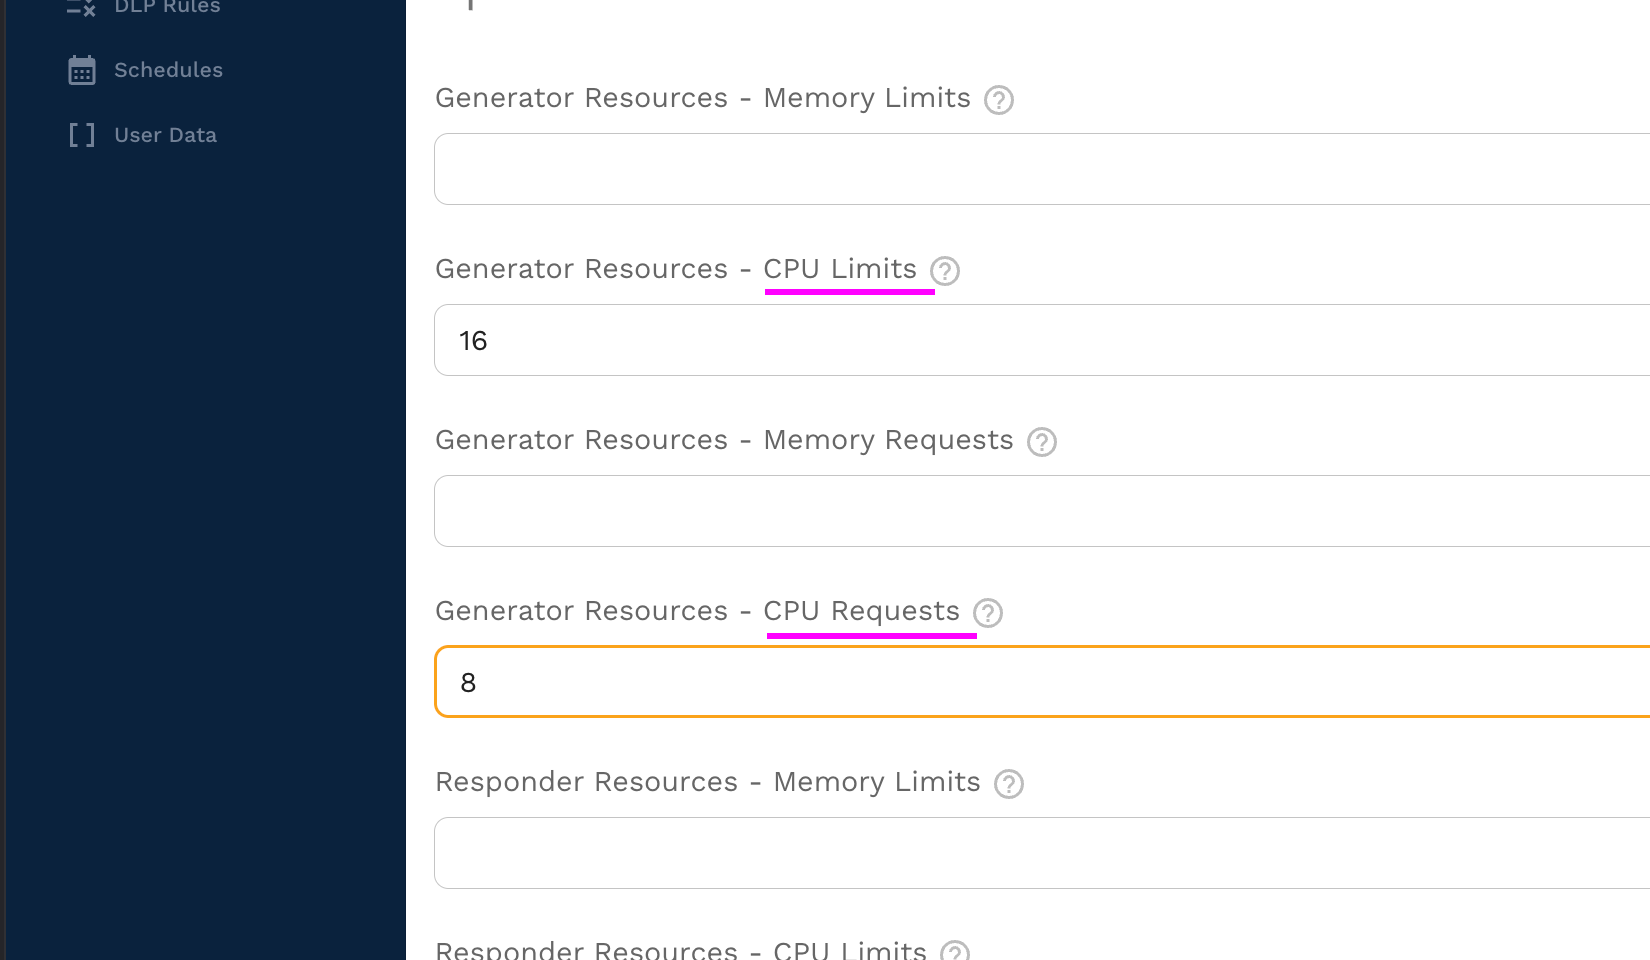
To ensure the generator has enough CPU for the task set cluster requests / limits in the test config. This can be configured under the "Cluster" tab.

On the cluster tab set the "Generator Resources" to set CPU requests and limits on the Speedscale generator pod.

Best Practices
This section provides some best practices for setting up a high-throughput generator.
CPU
Ensure the generator has ample CPU and is not saturated. Reports will show an error if the generator is being CPU throttled.
Dedicated Node
Dedicate a node to the generator using a Kubernetes taint and toleration.
Taint the node so no workloads will be scheduled on it.
kubectl taint nodes <node1> dedicated-to=speedscale-generator:NoExecute
Nodes given the NoExecute taint will evict all pods.
The Speedscale generator contains a toleration that will allow it to be scheduled on the tained node.
Remove the taint when done.
kubectl taint nodes <node1> dedicated-to=speedscale-generator:NoExecute-
Monitoring
This is tech so it's highly unlikely that everything will work exactly as expected the first time. Your app may not scale as you expect, or it may crash, or the generator won't reach the desired throughput. Understanding what your application is during during the load test will help guide you towards the next steps. Look at metrics, review logs, and monitor the environment to get the full picture. This obviously includes the application being tested but also databases, caches, third party services, etc.
The generator pod also exposes a endpoint on port 4145 which can be used to monitor internal metrics, provided your monitoring system is setup to support scraping short-lived workloads.
Multiple Generators
If you want to get more throughput than a single generator can provide, you can run multiple generators. This will generate multiple reports within the Speedscale UI, and you can see them grouped together under the Replays section of your snapshot.
Running Multiple Generators
First you need to copy this file and save locally, then edit the configuration section with appropriate values for your situation.
If you get an error when running the script you may need to configure permissions such as: chmod 755 multi-gen.sh.
#!/usr/bin/env bash

# This script will run multiple Speedscale replays in parallel.

###################
## CONFIGURATION ##
###################

SNAPSHOT="237046ff-98a6-43a8-9f76-5a6f74f008c4"
TEST_CONFIG="performance_100replicas"
CLUSTER="miniken"
NAMESPACE="default"
WORKLOAD="nginx-deployment"
GENERATOR_COUNT="4"

############
## SCRIPT ##
############

set -e

TEST_ID=$(date +%s)

for ((i=1; i<=GENERATOR_COUNT; i++))
do
  echo "Iteration $i of $GENERATOR_COUNT: Running snapshot $SNAPSHOT"
  speedctl infra replay "$WORKLOAD" \
    --namespace "$NAMESPACE" \
    --cluster "$CLUSTER" \
    --snapshot-id "$SNAPSHOT" \
    --test-config-id "$TEST_CONFIG" \
    --build-tag "TS:${TEST_ID} Replay:$i/$GENERATOR_COUNT"
done

Note that the output of the speedctl infra replay command includes the report id for each of the reports.
FAQ
Why doesn't the number of TPS/RPS increase when I add more vUsers?
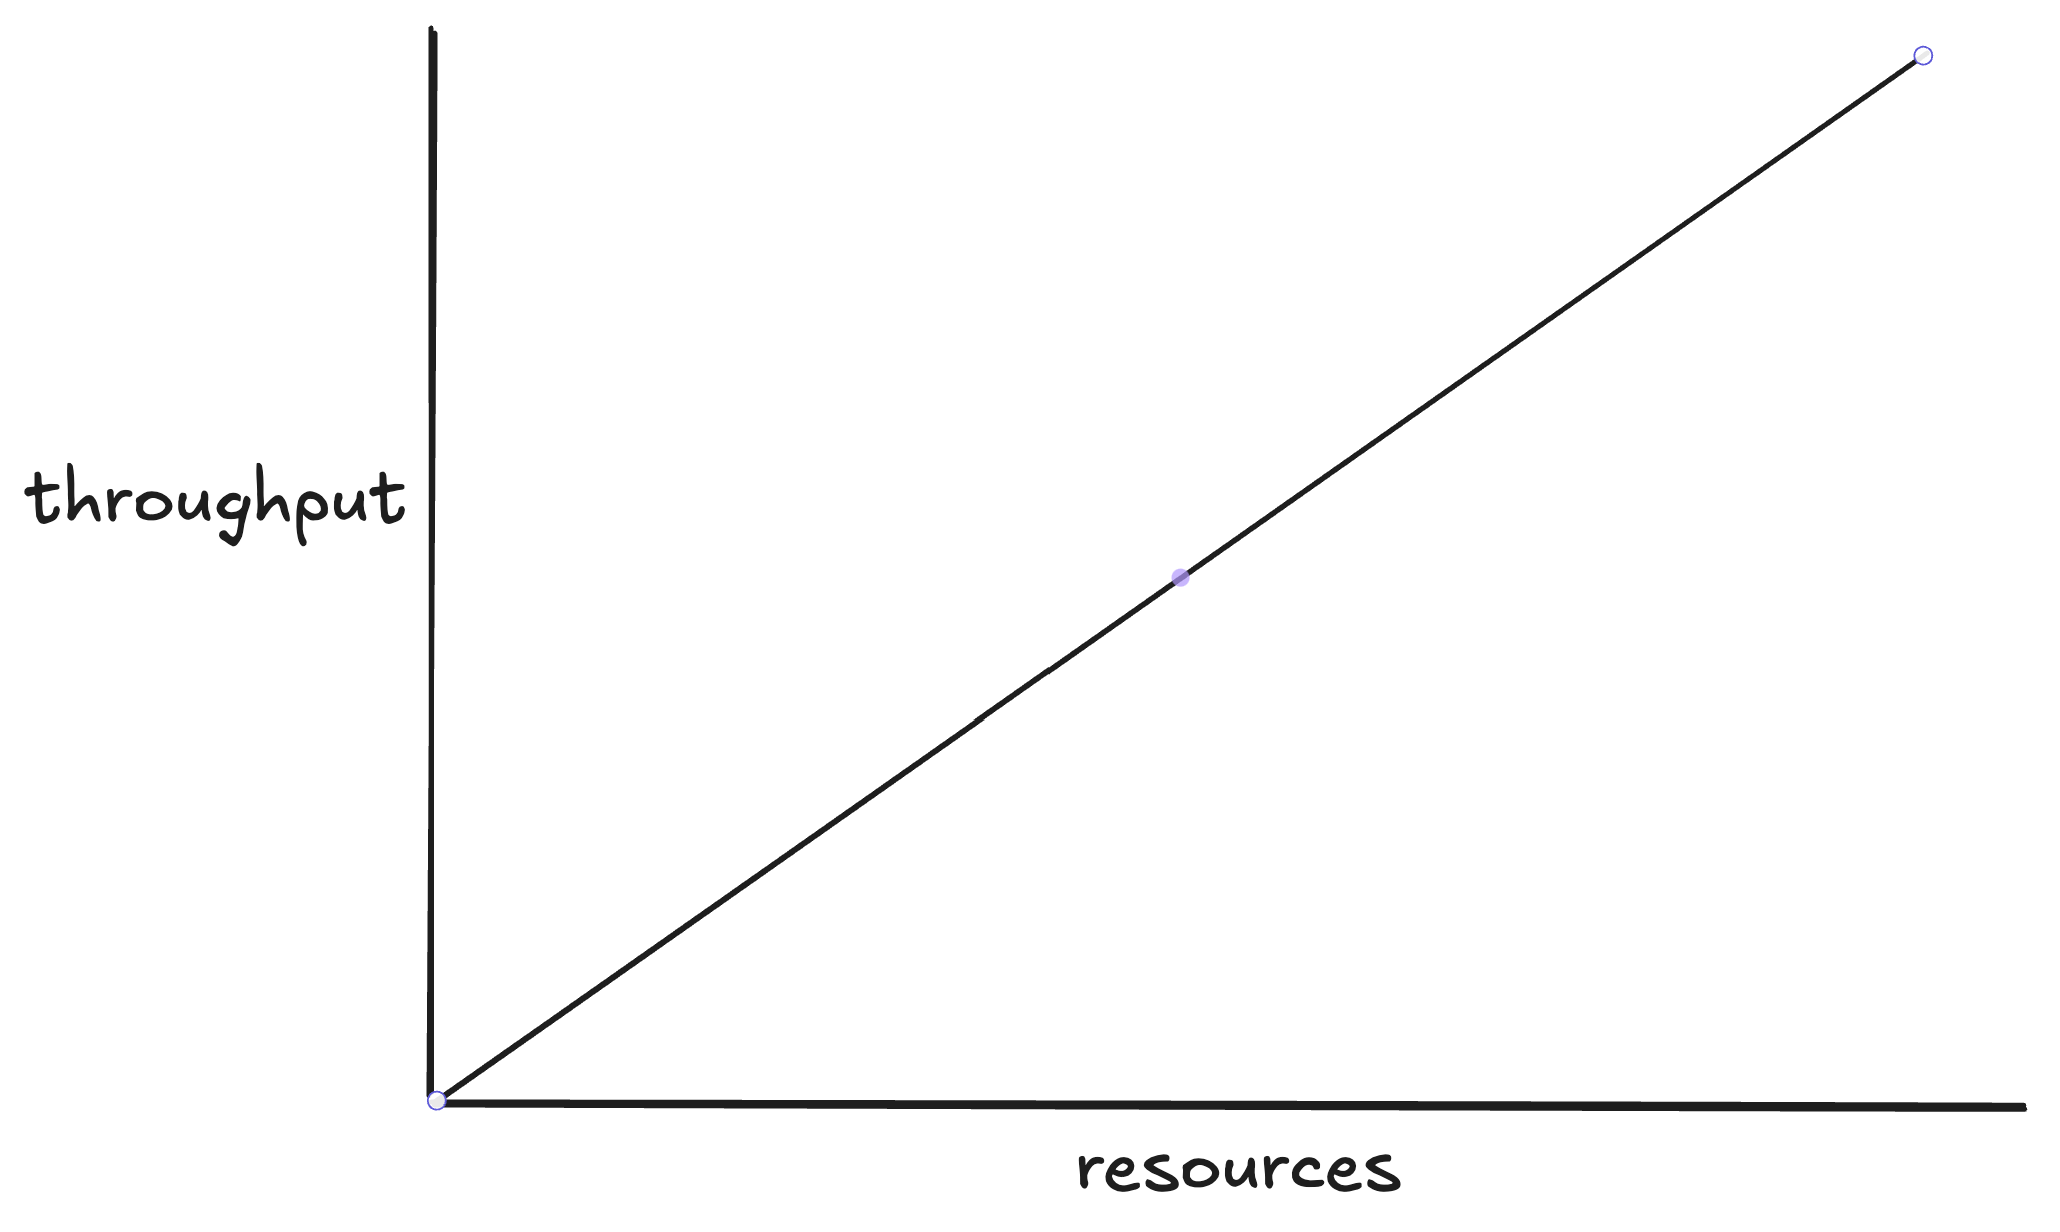
Generally, the more vUsers the more traffic... but not always. The best an application can hope to scale is linealy, as shown below. For example, if a static webpage can handle 1000 RPS with 1 server node it will be able to handle 10,000 with 10 because there are no shared resources to cause bottlenecks.

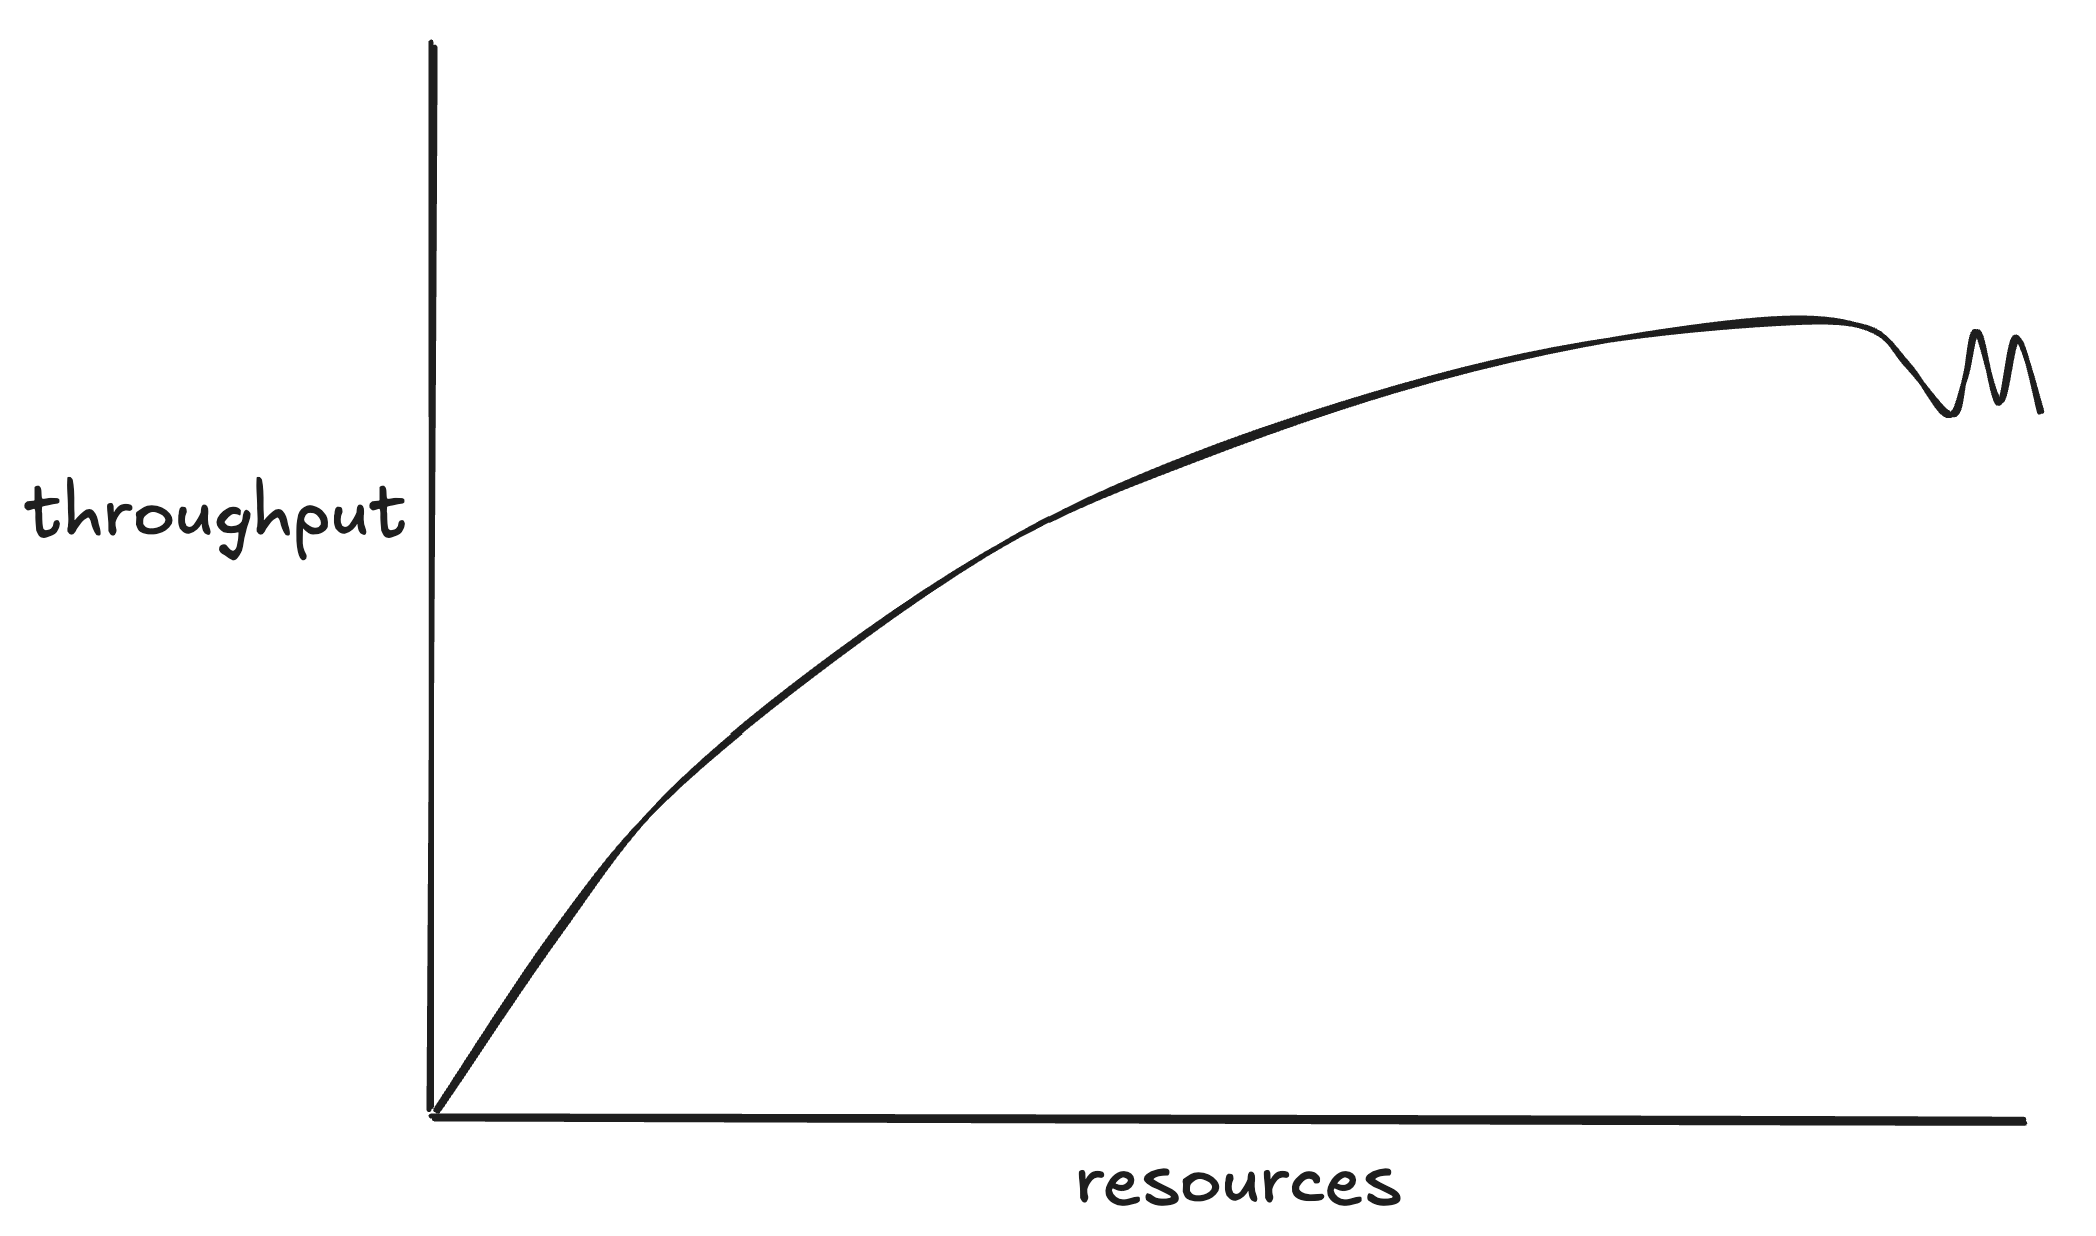
Unfortunately most applications are more complex than a static webpage and do not scale linearly. Instead they tend to increase pressure on their bottlenecks as load is increased.

This situation arises when the application cannot respond fast enough to go any higher. This can happen for a number of reasons.
-
Requests are consistently slow because of some resource constraint. The culprit here is usually a resource shared by all instances of your app, like a hot database table or shared cache key.
-
A few slow requests are limiting throughput. See below.
Unlike traditional load testing tools, the Speedscale Generator acts like a real client which means it waits for responses. As a result, each vUser "blocks" for a period of time waiting for the application's response before moving on to the next request. Imagine what happens to overall throughput when every request is 100 milliseconds except one that takes 5 seconds. Throughput will suffer severely as the next 100ms request will wait 5s to execute. That means it's possible for all vUsers to be fully utilized but the app simply can't go any faster. This shows up as TPS/RPS topping out lower number than expected.
The solution to this problem is usually to increase the resources allocated to the SUT. If you give it more head room and the TPS/RPS goes up then the app may be CPU/Memory limited. If that doesn't work then it may be blocking on a call to a backend system like a database that is slowing down the overall request.