Migrating from JMeter
This guide records the requests made by an Apache JMeter test plan and turns them into Speedscale traffic snapshots. Speedscale does not import .jmx files directly.
Run JMeter through the Speedscale recorder with one virtual user, then use Speedscale load patterns to scale the captured requests. Record each logical test section separately so it is easy to recombine later.
Turn your vUser settings down to one and record each test script as a separate snapshot. Speedscale already knows how to scale up traffic, merge test suites, etc. It's best to start with the cleanest run possible and use Speedscale's built-in functionality.
Pre-Migration Checklist
- Inventory of JMeter Scripts: List all the JMeter scripts you intend to migrate.
- Understand the Test Scenarios: Ensure you understand the logic, parameters, and datasets used in your JMeter scripts.
- Speedscale Setup: Ensure you have speedctl installed.
Step-by-Step Migration Process
-
Analyze JMeter Test Plan:
- Open your JMeter test plan (.jmx file) and review the test components, such as Thread Groups, HTTP Requests, Samplers, Controllers, and Listeners.
- Note any custom scripts, plugins, or configurations used. Ensure that any additional plug in protocols are supported in Speedscale's support page.
-
Recreate Test Structure in Speedscale:
- Many JMeter test plans are already logically oriented and it is usually wise to create a new snapshot for each section. For example, you may want to record the authorization section once and use it over and over before each test plan. Record that as its own snapshot and then merge it into each replay.
- More recordings is better than larger recordings. You can always recombine sections after recording but it's harder to split sections up.
- Make sure you use consistent service names for each snapshot you record (remember this for the
speedctl capture <service name>below)
-
Replicate Load Patterns:
Review Speedscale's default load patterns to see if one already fits your needs. You can skip over this section entirely if so.
- Create a new test config using the Speedscale UI. Look for the "Create Test Config" button or you can clone from an existing one like 100replicas.
- Modify the Load Pattern section to match the virtual-user volume and timing of the original JMeter script.
- Migrate CSV Data Sets:
Manual CSV import is usually not necessary in this type of migration. If JMeter iterates a CSV then the CSV data is by definition stored within the requests that are recorded. Speedscale will see every request/response and determine that there is a field with changing data within.
- If CSV data must be manually migrated (see tip above) then upload the CSV to Speedscale using the
speedctl push userdata my_data_1 <file.csv>command or using the Speedscale UI. - Find the data field that needs replacing in your traffic and replace it using either the smart_replace_csv or csv_iterator transforms.
- You can also run the JMeter script and extract recorded values into CSVs later. See
speedctl extract --help.
- Assertions:
In most cases, Speedscale's default assertions will be more than adequate and this section can be skipped. Speedscale already knows what to assert on because it can see the application's response while JMeter is running.
- To manually edit assertions to cover a special use case, open the test config you created in step 3 (or make a new one).
- Click on the "Assertions" tab and modify as desired.
- Remember to save changes.
- Think Time and Pacing:
Speedscale automatically records the think time and pacing of transactions. No special action is required if you simply want to replicate JMeter timings.
- Keep in mind that pacing can be altered for each load pattern step. See step 3 for information on load patterns. If you need to alter individual request timings beyond what is recorded from JMeter you can alter them using the latency extractor.
- Start Speedscale Recorder:
- Open a terminal on your local desktop (or the machine running JMeter).
- Start the Speedscale recorder by running the following command. Replace
<service_name>and<listener_port>to match the service JMeter will be talking to - For testing purposes the command might look like this:
speedctl capture localhost 8080 - Ensure the service that JMeter is talking to is running.
speedctl capture <service_name> <listener_port>
- Run JMeter Script:
- Remember to dial back your vUsers.
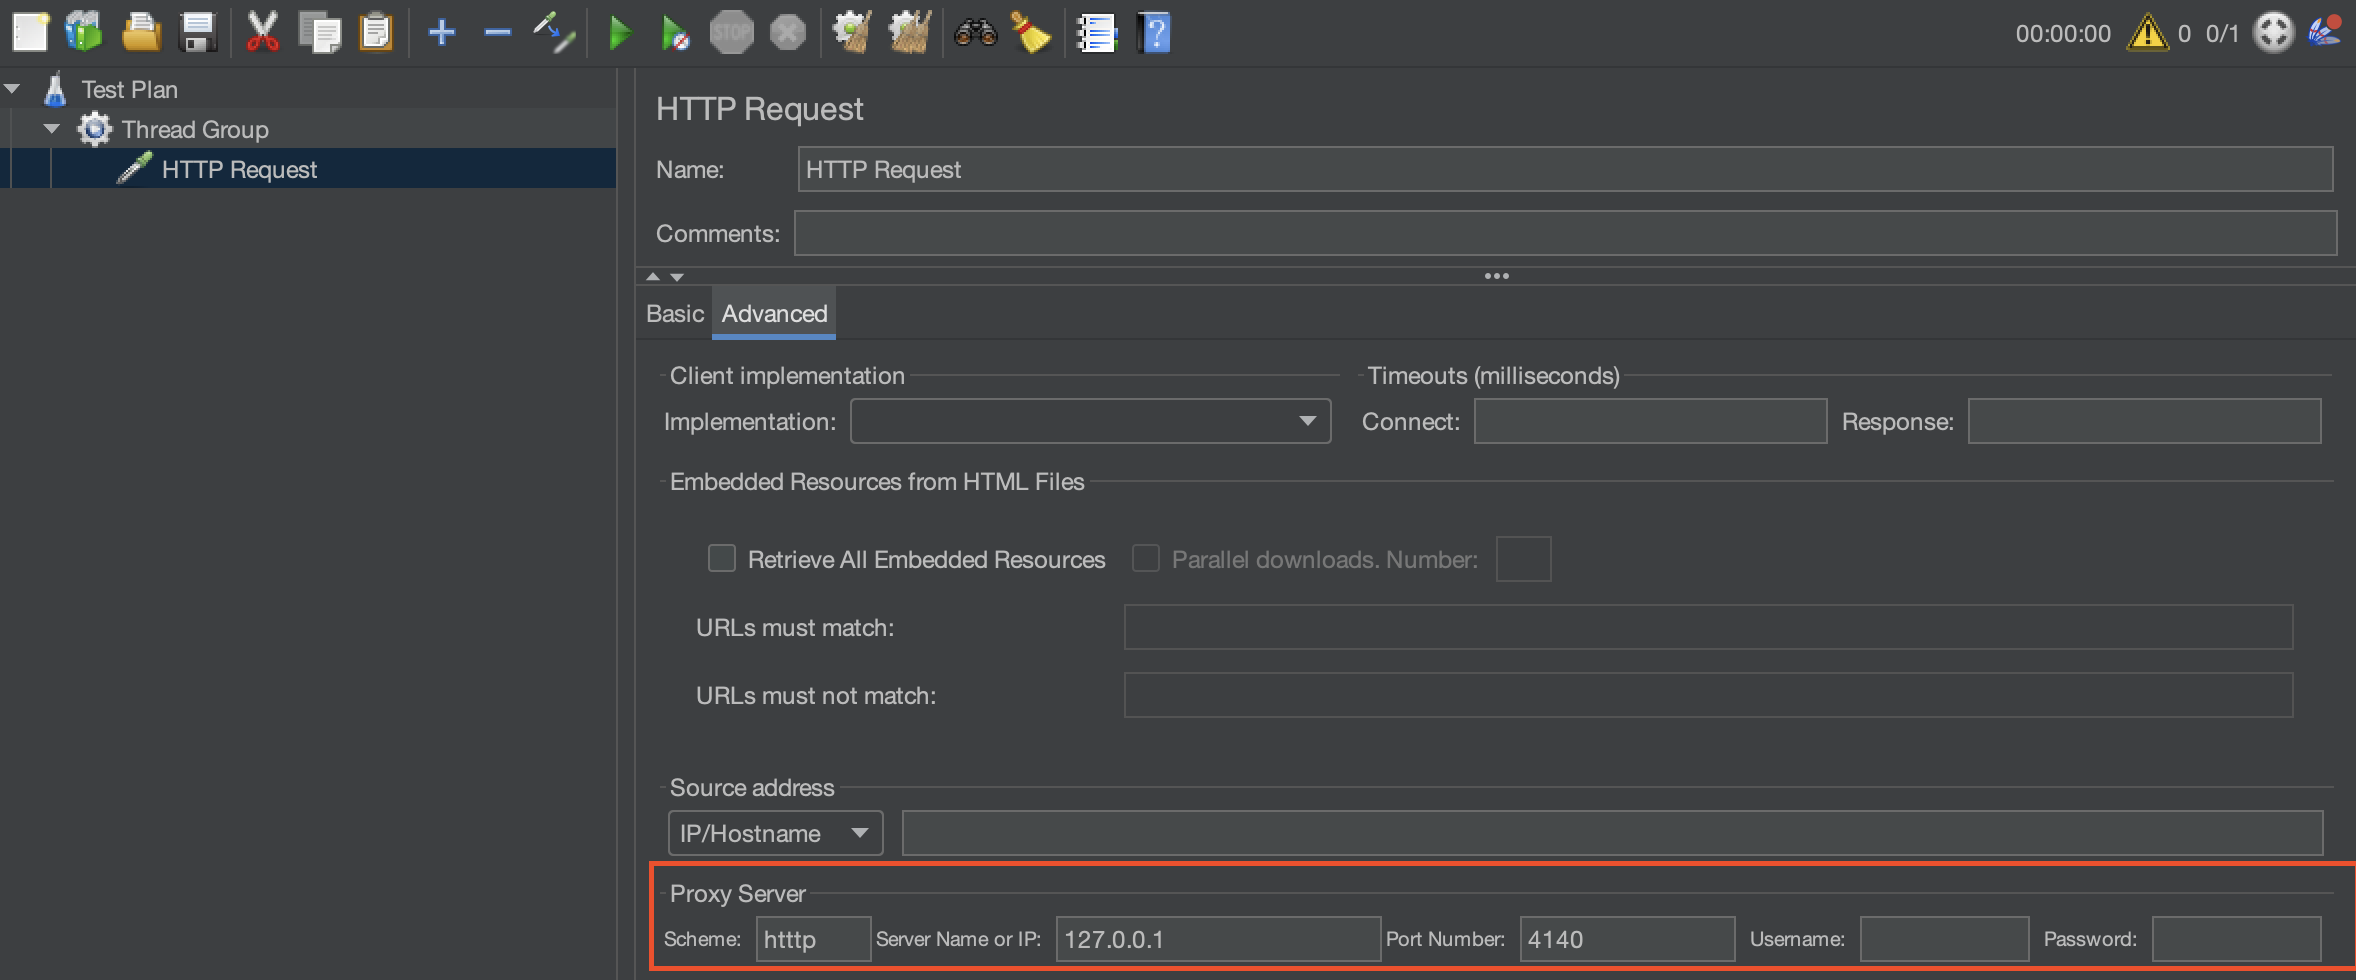
- Change the proxy settings in JMeter to point at the Speedscale recorder (the settings you need were outputted by the
speedctl capturecommand) - Press the Play button for each section you would like to record.
- Don't worry about breaking up the traffic into snapshots yet. Just record everything and you can break it up in the next section. It is helpful to put some time between each traffic set (or filter it by endpoint, etc) to make it easier to visually delineate.
Here is an example of adding these proxy settings for one request:
- Create Snapshot(s):
- Open the Speedscale traffic viewer.
- Select your
service_namefrom the dropdown or service filter. - Review the traffic you recorded.
- Select a time range and filter set that isolate a test suite.
- Click the "Save" button.
- Repeat this process for each snapshot you would like to create.
Traffic is immutable and many snapshots can be created from the same recording. In other words, don't be afraid of making mistakes because you can start over easily.
- Run replay:
- View one of the snapshots you created.
- Click "Replay" to start the replay wizard.
- In the replay wizard, make sure you select the test config you created in the previous steps (if necessary) to run the correct load pattern and assertions. JMeter combines all aspects of a test into the test suite. Speedscale breaks up the traffic (what) with the load pattern (how) for more seamless automation.
- View report and results.
Local proxymock alternative
If you only need local RRPair files, run proxymock record and configure JMeter to use the HTTP proxy address printed by the command. Stop the recorder after the single-user JMeter run, then replay the captured inbound requests locally:
proxymock replay --in ./proxymock --test-against http://localhost:8080
This records HTTP behavior; it does not convert JMeter thread groups, assertions, timers, or other .jmx configuration.
Let us know on the community Slack if you need additional help or advice.