---
title: "Kafka consumer-group health and kafka-report | Speedscale Docs"
description: "Report how your app's Kafka consumer groups behaved in a proxymock recording or a Speedscale snapshot: members, rebalances, per-partition lag and commit lag, and findings for consumer lag, stuck partitions, poll timeouts, offset resets and repeated rebalances, with no broker access."
canonical: "https://docs.speedscale.com/proxymock/kafka/consumer-group-health/"
---
[Documentation index](https://docs.speedscale.com/proxymock/llms.txt) | [Markdown](https://docs.speedscale.com/proxymock/kafka/consumer-group-health/index.md) | [Canonical page](https://docs.speedscale.com/proxymock/kafka/consumer-group-health/)
# Kafka consumer-group health and kafka-report
The Kafka consumer-group health report answers "what did my consumers actually do?" from a recording. It reads the client side of your app's Kafka traffic and reports, for each consumer group, who joined and left, how long each rebalance took, how far behind each fetched partition was, and what went wrong. It needs no broker access, admin client or JMX: everything comes from the requests your app sent and the responses it got back.
It is built for the problems a broker-side lag graph shows but cannot explain: a record the consumer keeps seeking back to, a consumer dropped from its group for going too long between polls, or a partition that started at the latest offset and skipped the records already there.
## Record consumer traffic
Record your app while it consumes, as described in [Record Kafka traffic](https://docs.speedscale.com/proxymock/kafka/record/). The report reads the consumer-group calls a client makes: `JoinGroup`, `SyncGroup`, `Heartbeat`, `LeaveGroup` and `ConsumerGroupHeartbeat` for membership, and `Fetch`, `ListOffsets`, `OffsetFetch` and `OffsetCommit` for positions. Both the classic group protocol and the KIP-848 consumer protocol (`group.protocol=consumer`) are supported.
In Kubernetes, record with the Speedscale operator as usual, with no `--map` setup; see [Kubernetes and eBPF](https://docs.speedscale.com/guides/message-brokers/kafka/#kubernetes) and [In a snapshot](https://docs.speedscale.com/proxymock/kafka/consumer-group-health/#in-a-snapshot).
## From the CLI or an AI assistant
`proxymock kafka-report` prints the report for one or more recording directories. It is also the `kafka_report` tool of the [proxymock MCP server](https://docs.speedscale.com/proxymock/how-it-works/mcp-tools/), so an AI coding assistant can read it while it changes your consumer code. The MCP tool returns the text form shown below.
```bash
proxymock kafka-report --in proxymock/recorded-2026-10-12_17-52-00.692378Z -o pretty
```
From a recording of test consumers that lag, hit a poison record, time out between polls and reset their offsets, shortened:
```text
Kafka consumer-group health, 2026-10-12T17:52:01Z to 2026-10-12T17:52:34Z
Lag covers the partitions this service's consumers fetched, measured from their own Fetch responses. It is not whole-group lag: partitions the recorded clients did not fetch are not shown.
Findings (10)
warning CONSUMER_LAG kraken-lag health-lag/0@5 (count 15)
kraken-lag's last fetch of health-lag/0 left it at offset 5 with the high watermark at 20, 15 records behind; its committed offset 5 trails the high watermark by 15
warning STUCK_PARTITION kraken-poison health-poison/0@1 (count 7)
kraken-poison fetched health-poison/0 at offset 1 7 times over 7ms without committing past it, so the record at offset 1 is probably one it cannot process; the committed offset is 1
warning POLL_TIMEOUT kraken-rebalance (count 1)
kraken-rebalance-c stopped polling for longer than max.poll.interval.ms (3000 ms) and left kraken-rebalance: consumer poll timeout has expired.
warning REBALANCE kraken-rebalance (count 9)
kraken-rebalance rebalanced 9 times in 18.538s; the longest, generation 5, took 2942 ms after kraken-rebalance-c joined
warning OFFSET_RESET kraken-reset health-reset/0@5 (count 5)
kraken-reset had no committed offset for health-reset, so auto.offset.reset=latest started partition 0 at offset 5 (LATEST), skipping the 5 records already there
Group kraken-lag (classic protocol, assignors range, cooperative-sticky)
member kraken-lag (kraken-lag-8f572c2e-0bfa-4220-9a4d-56b9fa0540b2) rebalance timeout 300000 ms, session timeout 45000 ms, left after 95ms: the consumer is being closed
rebalance to generation 1 took 30 ms, members kraken-lag: kraken-lag joined
health-lag/0 last fetch 4, high watermark 20, lag 15, committed 5, commit lag 15
Clients
kraken-lag: 5 fetches, 1 empty fetches, 0 heartbeats over 100ms
kraken-rebalance-a: 0 fetches, 38 empty fetches, 6 heartbeats over 19.345s
```
| Flag | What it does |
| --- | --- |
| `--in` | The recording, or several, to report on; defaults to the current directory |
| `-o` | `json` (the default) or `pretty` |
If the directories hold no consumer-group traffic, the command exits with an error that says so.
## Read the report
**Findings** come first, one line each with its severity, kind, group and location, then the sentence that explains it; see [Findings](https://docs.speedscale.com/proxymock/kafka/consumer-group-health/#findings) for each kind.
**Group** shows each consumer group with its protocol, `classic` or `consumer` (KIP-848), and the partition assignors its members offered (classic) or asked the broker for (consumer). The protocol is missing when the recording held only offset commits for the group.
**member** lines list every membership from joining to leaving: the client ID, the member ID, the rebalance timeout (the client's `max.poll.interval.ms`) and, for classic members, the session timeout. A member that left shows how long it stayed and the reason it gave. A client that is removed and joins again under a new member ID appears twice.
**rebalance** lines list every new generation (classic) or group epoch (consumer protocol), with what started it, such as a member joining or leaving, how long it took from that trigger until the last member settled into the new generation, and the client IDs in it.
**Partition** lines show each topic partition the group's clients fetched or committed:
* **last fetch**: the offset the last recorded `Fetch` asked for.
* **high watermark**: the latest one a `Fetch` or `ListOffsets` response reported.
* **lag**: how many records were past what the client had been handed after its last fetch.
* **committed**: the latest offset the group committed, or the coordinator returned.
* **commit lag**: how many records were past the committed offset.
A `-` marks a value missing from the recording, such as every value of a partition the group was assigned and never fetched records from.
**Clients** shows how often each client ID fetched, polled with nothing returned, and sent a heartbeat, so idle polling shows next to the fetches that returned records.
note
Lag covers only the partitions the recorded clients fetched, measured from their own `Fetch` responses. It is not whole-group lag: partitions that other consumers of the group read, outside the recording, are not shown.
## Findings
Each finding has a kind, a severity (`warning` or `info`), the group, and where it applies the client, topic, partition and offset, plus a count and a sentence explaining it.
| Kind | What it means | Raised when | Count |
| --- | --- | --- | --- |
| `CONSUMER_LAG` | A fetched partition was left far behind its high watermark. | Lag after the client's last fetch is 10 records or more. Always a warning. | Records behind |
| `STUCK_PARTITION` | The consumer keeps fetching the same offset without committing past it, usually a poison record it cannot process and seeks back to. | One offset is fetched with records 3 or more times and no commit moves past it in that time. Always a warning. | Repeated fetches |
| `POLL_TIMEOUT` | A member went longer than `max.poll.interval.ms` without polling. | A classic member leaves with a poll-timeout reason, or is dropped from the next generation and joins again later; or a consumer-protocol member leaves and rejoins as the same member. Always a warning. | Timeouts |
| `OFFSET_RESET` | A partition had no committed offset, so `auto.offset.reset` chose where to start. | The client found no usable offset and asked `ListOffsets` for the latest or earliest one. A warning when `latest` skipped records already in the partition, otherwise info. | Records skipped |
| `REBALANCE` | A group rebalanced more than once. | The group went through two or more generations or epochs. A warning when a poll timeout started one of them, otherwise info. | Rebalances |
A single rebalance when the first member joins is normal and is not a finding.
## In a snapshot
When Speedscale analyzes a snapshot that holds Kafka consumer traffic, it builds the same report and stores it with the snapshot as `kafka-report.json`, the same JSON that `proxymock kafka-report -o json` prints. Snapshots without consumer traffic have none.
* In the dashboard, open the snapshot's **Traffic** tab and choose **Kafka**. The pane shows the findings, then each group's members, rebalances and partitions, and the polling per client. The **Kafka** choice appears only for a snapshot that has a report; reanalyze a snapshot recorded before the report existed to add one.
* `speedctl pull snapshot ` downloads `kafka-report.json` with the snapshot's other artifacts.
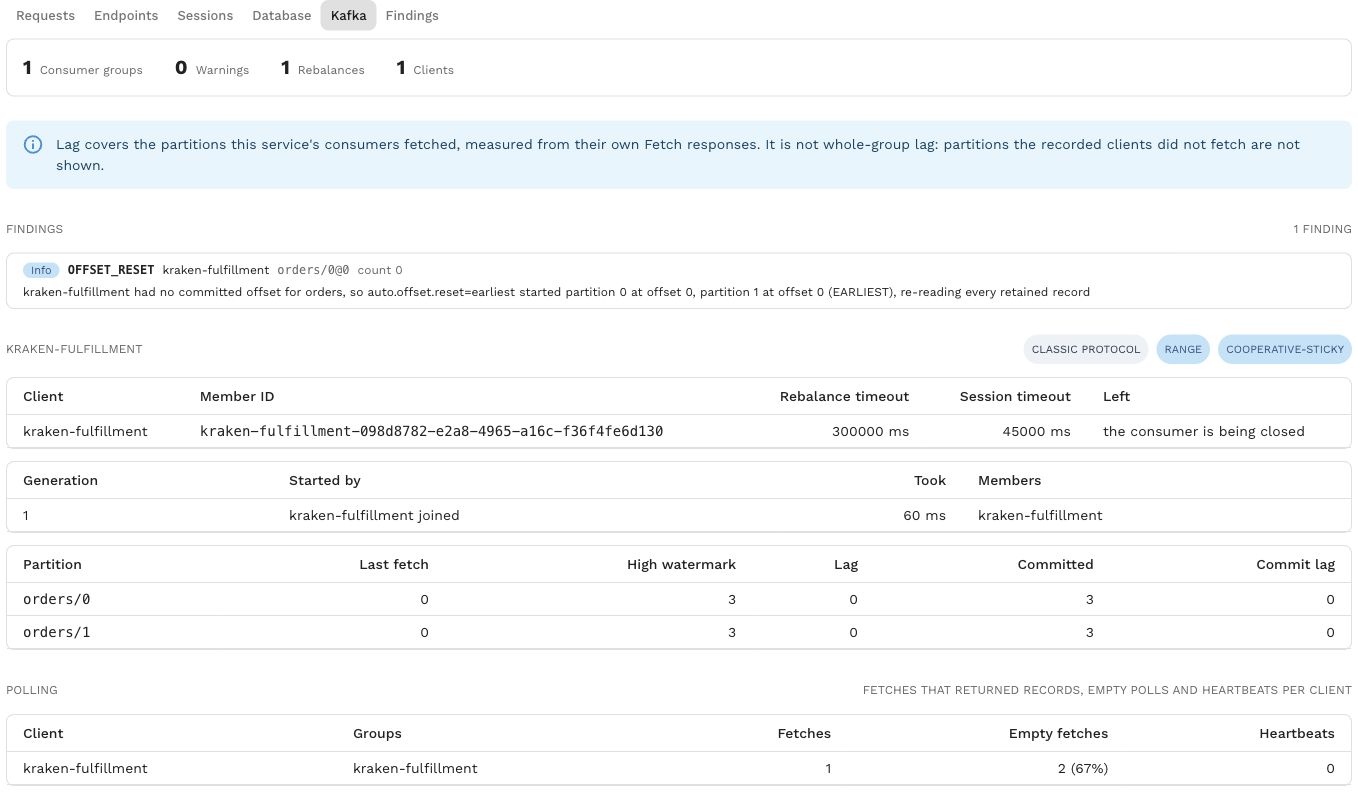
[Open screenshot full size](https://docs.speedscale.com/assets/images/snapshot-kafka-50f98c5d19742e04749cc6b75fea407e.jpg)
With `-o json`, or in `kafka-report.json`, the report has `caveat`, `start`, `end`, `groups`, `findings` and `clients`. Each group carries `groupId`, `protocol`, `assignors`, `members`, `rebalances` and `partitions`, and each partition `lastFetchOffset`, `highWatermark`, `lag`, `committedOffset`, `commitLag` and `fetches`. Offsets are plain numbers, and a value the recording did not show is left out.
## Related
* [Record Kafka traffic](https://docs.speedscale.com/proxymock/kafka/record/)
* [Mock a Kafka broker](https://docs.speedscale.com/proxymock/kafka/mock-kafka/)
* [Replay Kafka traffic](https://docs.speedscale.com/proxymock/kafka/replay/)
* [MCP tools reference](https://docs.speedscale.com/proxymock/how-it-works/mcp-tools/)