---
title: "Record GraphQL traffic | Speedscale Docs"
description: "Record the GraphQL requests your server receives or your app sends with proxymock, see what each recorded call holds, how persisted queries and other request shapes are kept, and read every request as an operation in proxymock web."
canonical: "https://docs.speedscale.com/proxymock/graphql/record/"
---
[Documentation index](https://docs.speedscale.com/proxymock/llms.txt) | [Markdown](https://docs.speedscale.com/proxymock/graphql/record/index.md) | [Canonical page](https://docs.speedscale.com/proxymock/graphql/record/)
# Record GraphQL traffic
proxymock records GraphQL the way it records any HTTP traffic: it sits in front of your server for the requests clients send it, and between your app and the APIs it calls for the requests it sends. Nothing about the server or the client changes beyond the address it uses.
## Record your GraphQL server
Start your server under the recorder, tell proxymock which port it listens on, and send requests to proxymock's inbound port, 4143, instead of the server's:
```bash
proxymock record --app-port 8080 -- ./your-server
```
In a second terminal, drive the server the way you want to test it: your client app, an end-to-end suite, or a script:
```bash
curl -s http://localhost:4143/graphql -H 'Content-Type: application/json' \
-d '{"query":"mutation CreateUser($email: String!) { createUser(input: {email: $email, plan: \"pro\"}) { id email } }","operationName":"CreateUser","variables":{"email":"ada@example.com"}}'
```
Stop the recorder with `Ctrl-C`. Each request is one file under `proxymock/recorded-/localhost/`, recorded as inbound traffic, ready to [replay as a test](https://docs.speedscale.com/proxymock/graphql/replay/).
## Record the GraphQL API your app calls
To record the requests your app sends, start the app under the recorder. proxymock sets the proxy environment variables for the app, so a client that honors them is recorded with no other change:
```bash
proxymock record -- ./your-app
```
Each request lands under a directory named after the API's host, recorded as outbound traffic, ready to [serve as a mock](https://docs.speedscale.com/proxymock/graphql/mock-graphql/).
Some clients never send `localhost` through a proxy. Go's standard HTTP client is one. For an API on your own machine, give proxymock a port in front of it with `--map` and point the app at that port instead:
```bash
proxymock record --map 18081=http://localhost:18080 -- ./your-app # the app calls http://localhost:18081/graphql
```
Requests through a mapped port are recorded under `localhost-`, here `localhost-18080`, so they never mix with your server's inbound traffic.
## What a recorded call holds
A GraphQL request is stored as a JSON representation of its parsed document, with the envelope's `operationName`, `variables` and `extensions` alongside it:
```json
{
"operationName": "CreateUser",
"query": { "Kind": "Document", "Definitions": [ ... ] },
"variables": { "email": "ada@example.com" }
}
```
This form is verbose, and you rarely need to read it: proxymock web lists what a transform can change, and the **Raw** tab shows the request as JSON with the query as text. Storing the parsed document is what lets proxymock match, edit and replay a request by its meaning. When the request is replayed, the document is printed back into query text, so what leaves proxymock is an ordinary GraphQL request.
The response is stored exactly as the server sent it. A GraphQL response is plain JSON, and errors ride in its `errors` array, usually with status 200.
Some requests to a `/graphql` path are kept exactly as they were sent, with no parsed document:
| Request | How it is kept |
| --- | --- |
| Automatic persisted query, a hash in `extensions.persistedQuery` and no query text | As sent, and replayed byte for byte. `variables` can still be edited. |
| Query in the URL, `GET /graphql?query=...` | As sent. It matches and replays on its query parameters. |
| Batched operations, a JSON array of requests | As sent, as plain JSON. |
| `Content-Type: application/graphql`, the query text as the body | As sent. |
## Read the recording
Open the recording with `proxymock web`:
```bash
proxymock web --in proxymock/recorded-
```
Each GraphQL call appears in the Requests list as `POST /graphql`, the way it reached the server, and its **Info** tab shows its tech as `GraphQL`. Select a call and open **Request → Body**. In place of the parsed document, proxymock web lists what the request does and every value a transform can change:
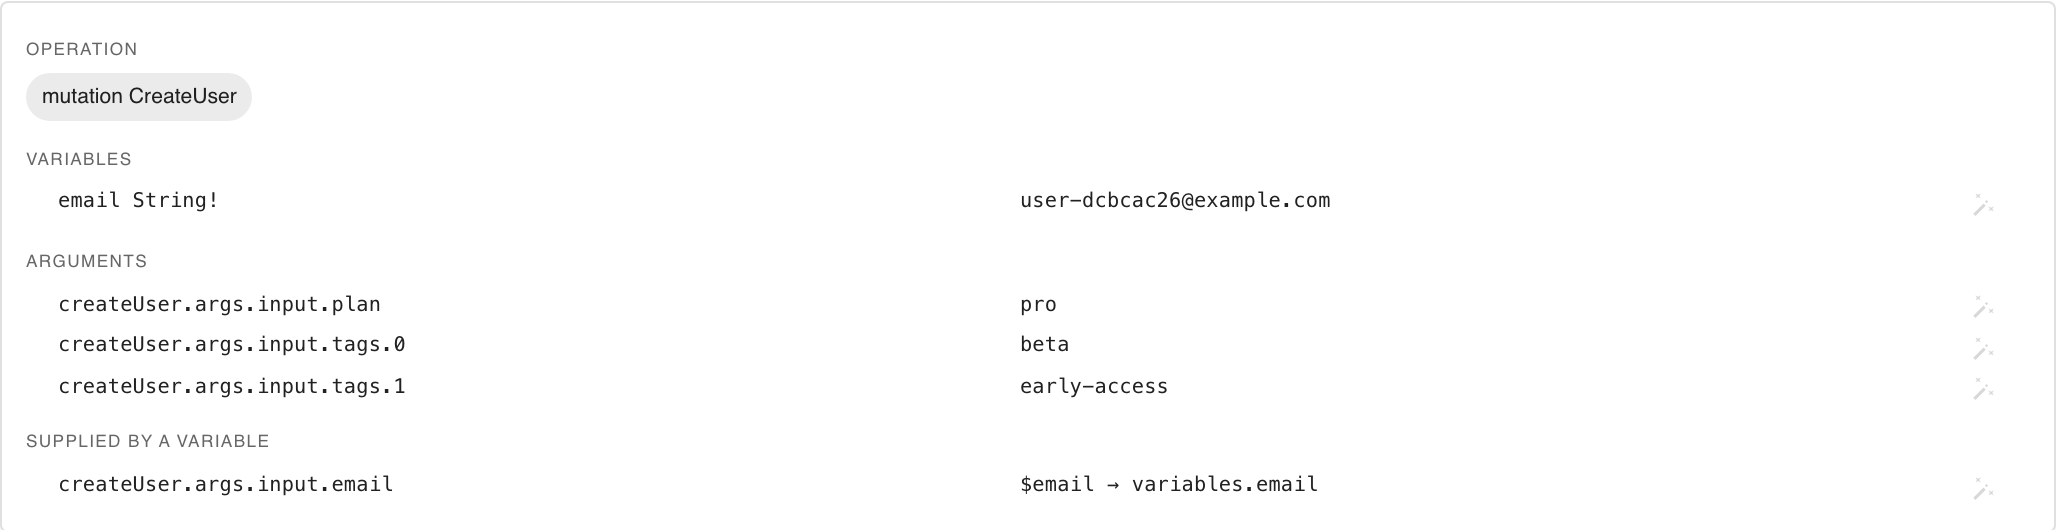
* **Operation** has a chip for each operation and named fragment the document defines. The operation this request runs is filled in. A document can define operations it does not run.
* **Variables** lists each variable with its declared type and recorded value.
* **Arguments** lists each literal written into the query, by its [semantic path](https://docs.speedscale.com/guides/graphql/semantic-paths/).
* **Supplied by a variable** lists the arguments a variable feeds, pointing at the `variables.` path where the value can actually change.
The button on each row opens the transform chooser, which saves a transform for that value into the **Field Transforms** blueprint. [Editing GraphQL requests](https://docs.speedscale.com/guides/graphql/editing/) describes the panel and the chooser in full.
## Operations in mock and replay
When `proxymock mock` or `proxymock replay` loads a recording, it labels each GraphQL call with its operation instead of the URL: the location becomes the operation name and the command becomes the operation type. That is how the replay report lists results:
```text
│ ENDPOINT │ METHOD │
│ CreateUser │ mutation │
│ Dashboard,UserFields │ query │
│ GetPlans,GetUser │ query,query │
│ Session │ query │
```
The label lists every operation and named fragment the document defines, whichever one the request runs. Above, `Dashboard,UserFields` is an operation that spreads a fragment, and `GetPlans,GetUser` is a document holding two operations, recorded twice with a different `operationName` each time. An anonymous operation is labeled by the root fields it selects. Persisted queries and the other requests kept as sent keep `/graphql` and their HTTP method.
## Next steps
* [Replay GraphQL operations](https://docs.speedscale.com/proxymock/graphql/replay/) against a new build of your server.
* [Mock a GraphQL API](https://docs.speedscale.com/proxymock/graphql/mock-graphql/) from the outbound recording.
* [Check coverage and conformance](https://docs.speedscale.com/proxymock/graphql/coverage-and-validate/) of the recording against your schema.