---
title: "Dynatrace | Speedscale Docs"
description: "Stream OpenTelemetry traces, metrics, and Speedscale captures to Dynatrace, with correlated services, errors, and API traffic."
canonical: "https://docs.speedscale.com/guides/integrations/export/dynatrace/"
---
[Documentation index](https://docs.speedscale.com/guides/llms.txt) | [Markdown](https://docs.speedscale.com/guides/integrations/export/dynatrace/index.md) | [Canonical page](https://docs.speedscale.com/guides/integrations/export/dynatrace/)
# Dynatrace
The Dynatrace integration sends application OpenTelemetry traces and metrics alongside normalized Speedscale capture logs. Application spans populate Services and Distributed Tracing. Capture logs identify the source workload, remote destination, protocol, command, and status; retain the full RRPair in Speedscale Cloud or a BYOC object-storage channel when it must be replayed.
Trace correlation requires a valid W3C `traceparent` header on the captured application request. Requests without one still appear in Logs, but Dynatrace cannot link them to an application trace.
## How it works
Dynatrace's ingest API accepts OTLP over HTTP. The collector receives gRPC or HTTP inside the cluster, then sends each signal to the correct Dynatrace path. It also:
* marks spans with HTTP 5xx responses or exception events as errors;
* identifies the source workload with `service.name` and `speedscale.workload`;
* identifies the remote destination with `hostname`, `server.address`, and `network.peer.address`;
* emits a readable message and `speedscale.protocol`, `speedscale.command`, and `speedscale.status` for HTTP, PostgreSQL, Kafka, and other captured protocols;
* extracts W3C trace context from captured request headers;
* converts cumulative metrics to delta temporality before export.
## Why use it
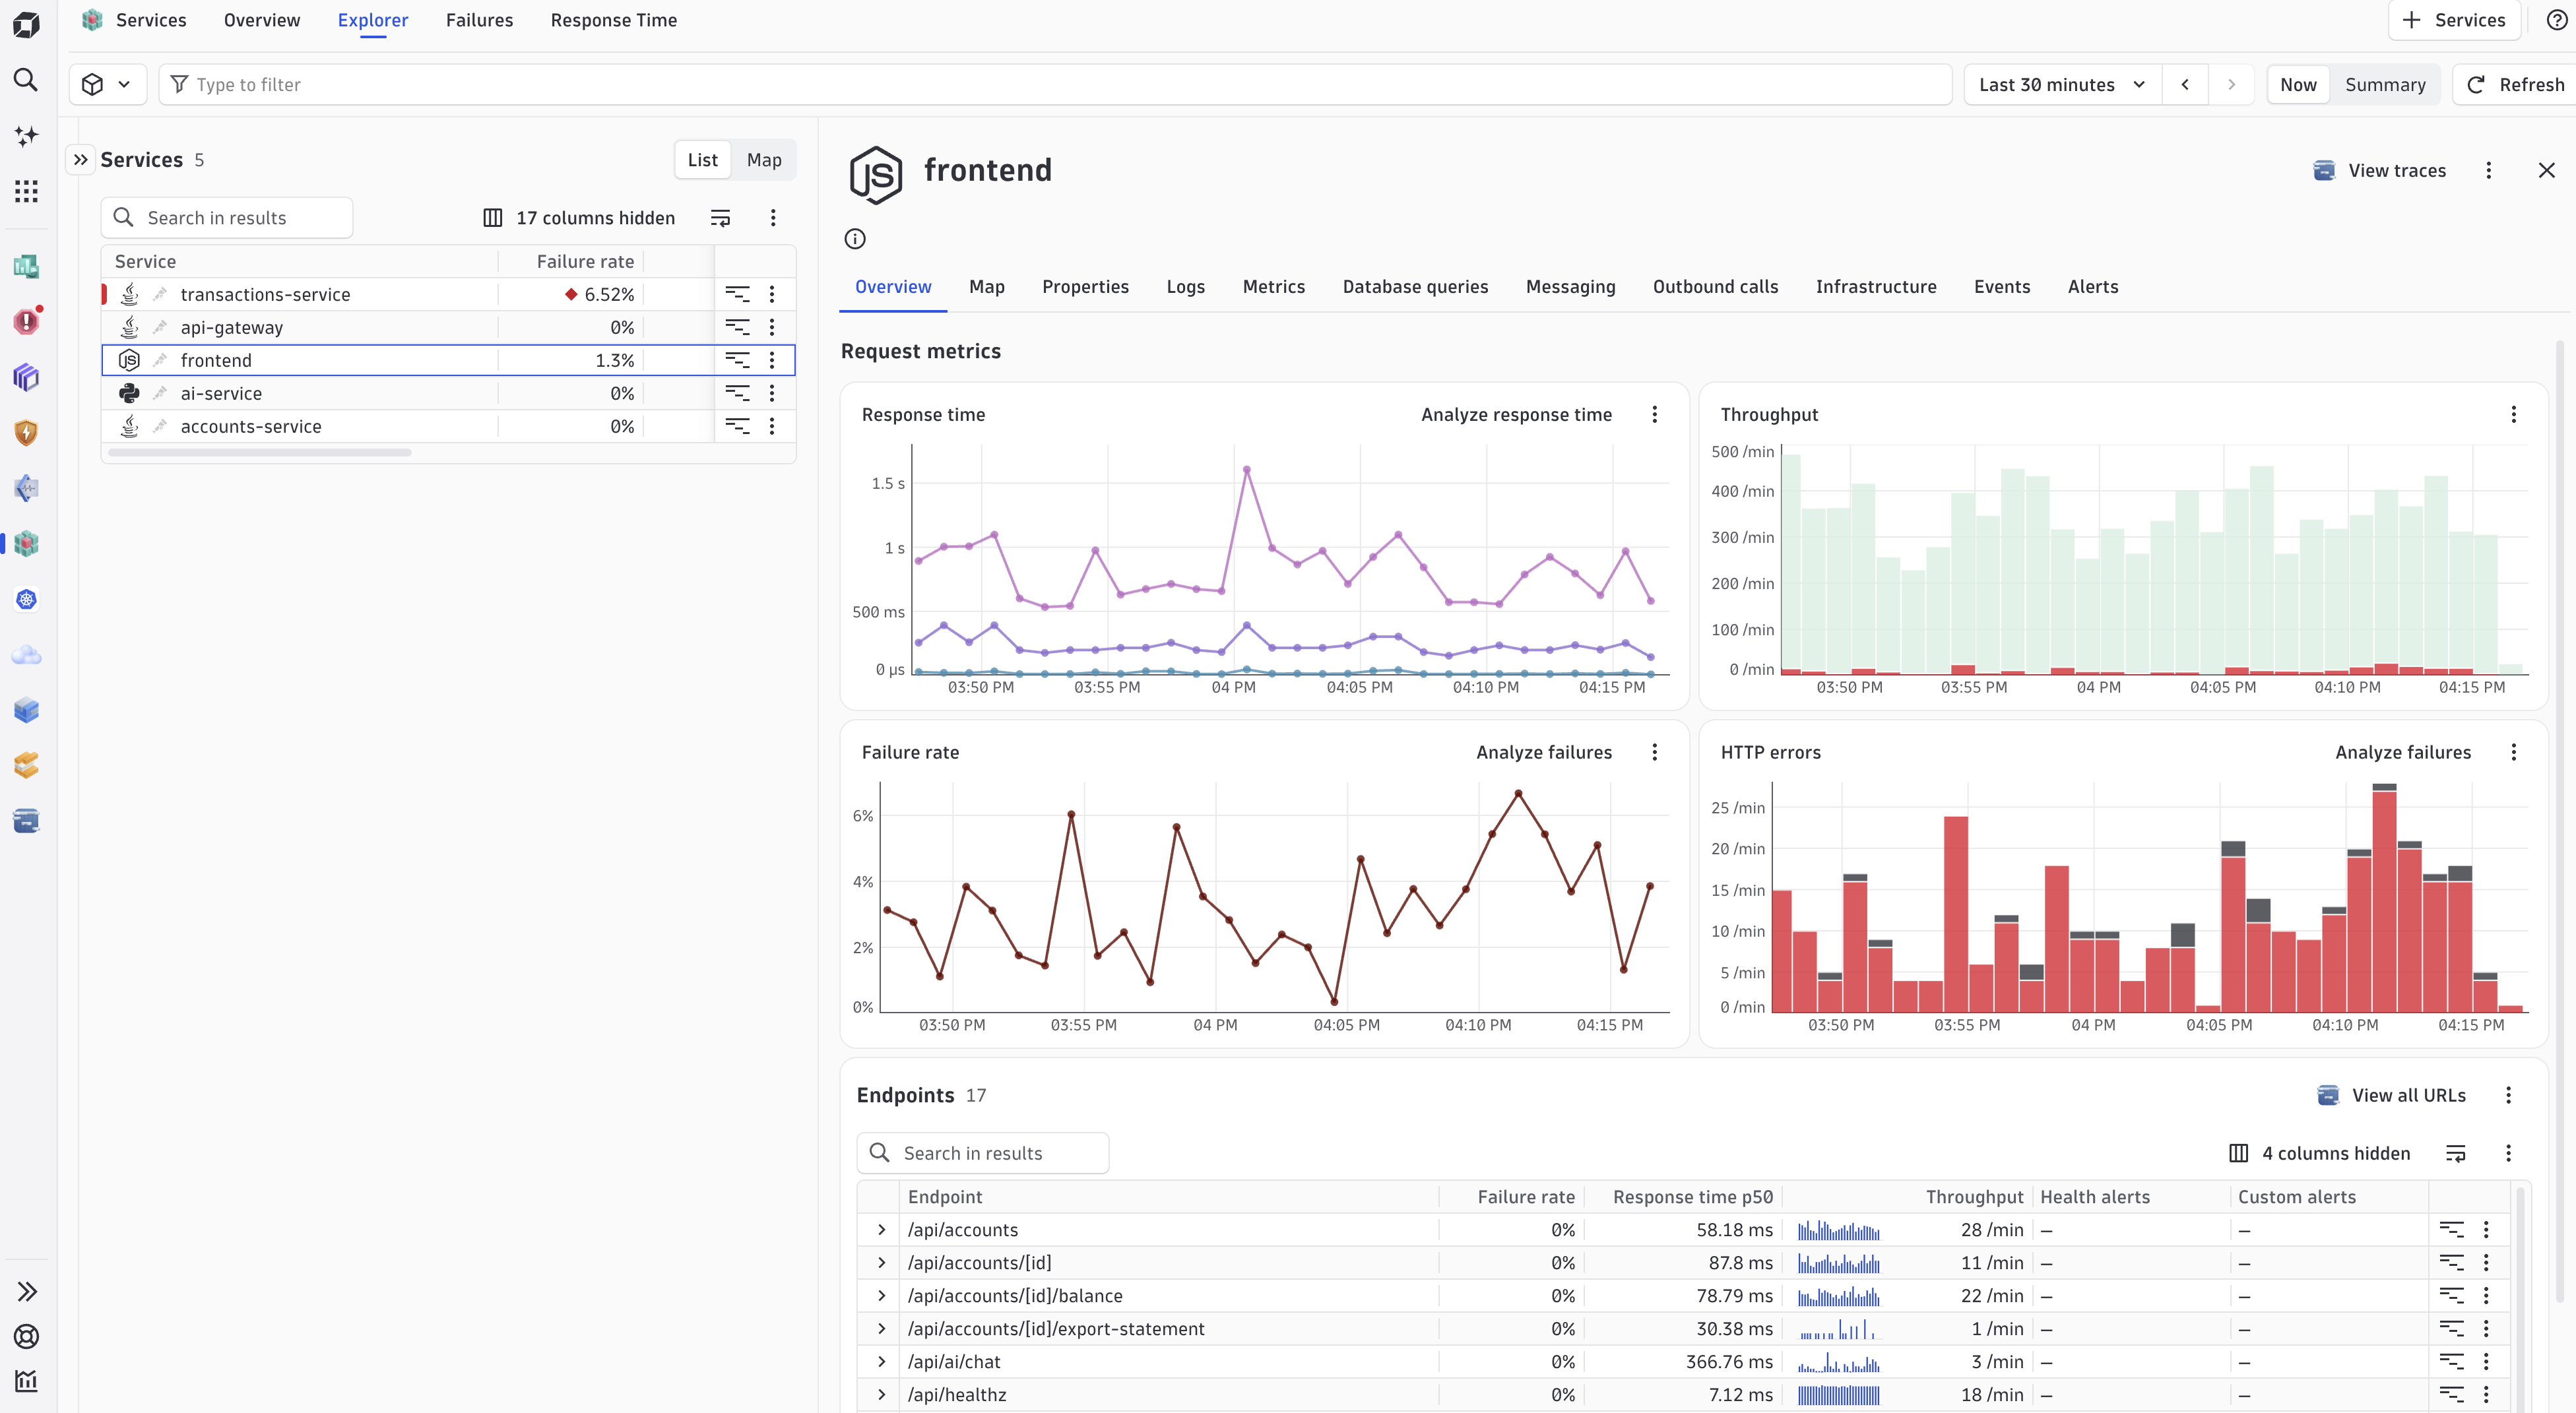
Dynatrace Services shows service health, request rate, response time, endpoints, and failures from the application spans. Distributed Tracing shows individual request paths. Speedscale capture logs add the protocol and remote-destination context needed to identify the corresponding full traffic in Speedscale Cloud or a BYOC object-storage channel.
## Install the channel
Create a Dynatrace access token with `openTelemetryTrace.ingest`, `metrics.ingest`, and `logs.ingest`. Store the token in a Kubernetes Secret:
```bash
kubectl create namespace byoc-dynatrace
kubectl -n byoc-dynatrace create secret generic dynatrace-api-token \
--from-literal=api-token=''
helm upgrade --install byoc-dynatrace speedscale-byoc/dynatrace \
--namespace byoc-dynatrace \
--set dynatrace.endpoint='https://.live.dynatrace.com/api/v2/otlp' \
--set dynatrace.credentialsSecret=dynatrace-api-token
```
The endpoint is the OTLP base URL. Do not add `/v1/traces`, `/v1/metrics`, or `/v1/logs`.
Add one Forwarder exporter for this channel:
```yaml
forwarder:
exporters:
byoc_dynatrace:
otel_endpoint: http://byoc-dynatrace-dynatrace.byoc-dynatrace.svc.cluster.local:4317
filter_rule: standard
dlp_config_id: standard
```
Send application OTLP data to the same collector service on port `4317` for gRPC or `4318` for HTTP.
The chart's NetworkPolicy only admits traffic from the `speedscale` namespace by default. Add each application namespace that sends OTLP data:
```bash
helm upgrade byoc-dynatrace speedscale-byoc/dynatrace \
--namespace byoc-dynatrace --reuse-values \
--set 'networkPolicy.allowedNamespaces={speedscale,}'
```
## Verify in Dynatrace
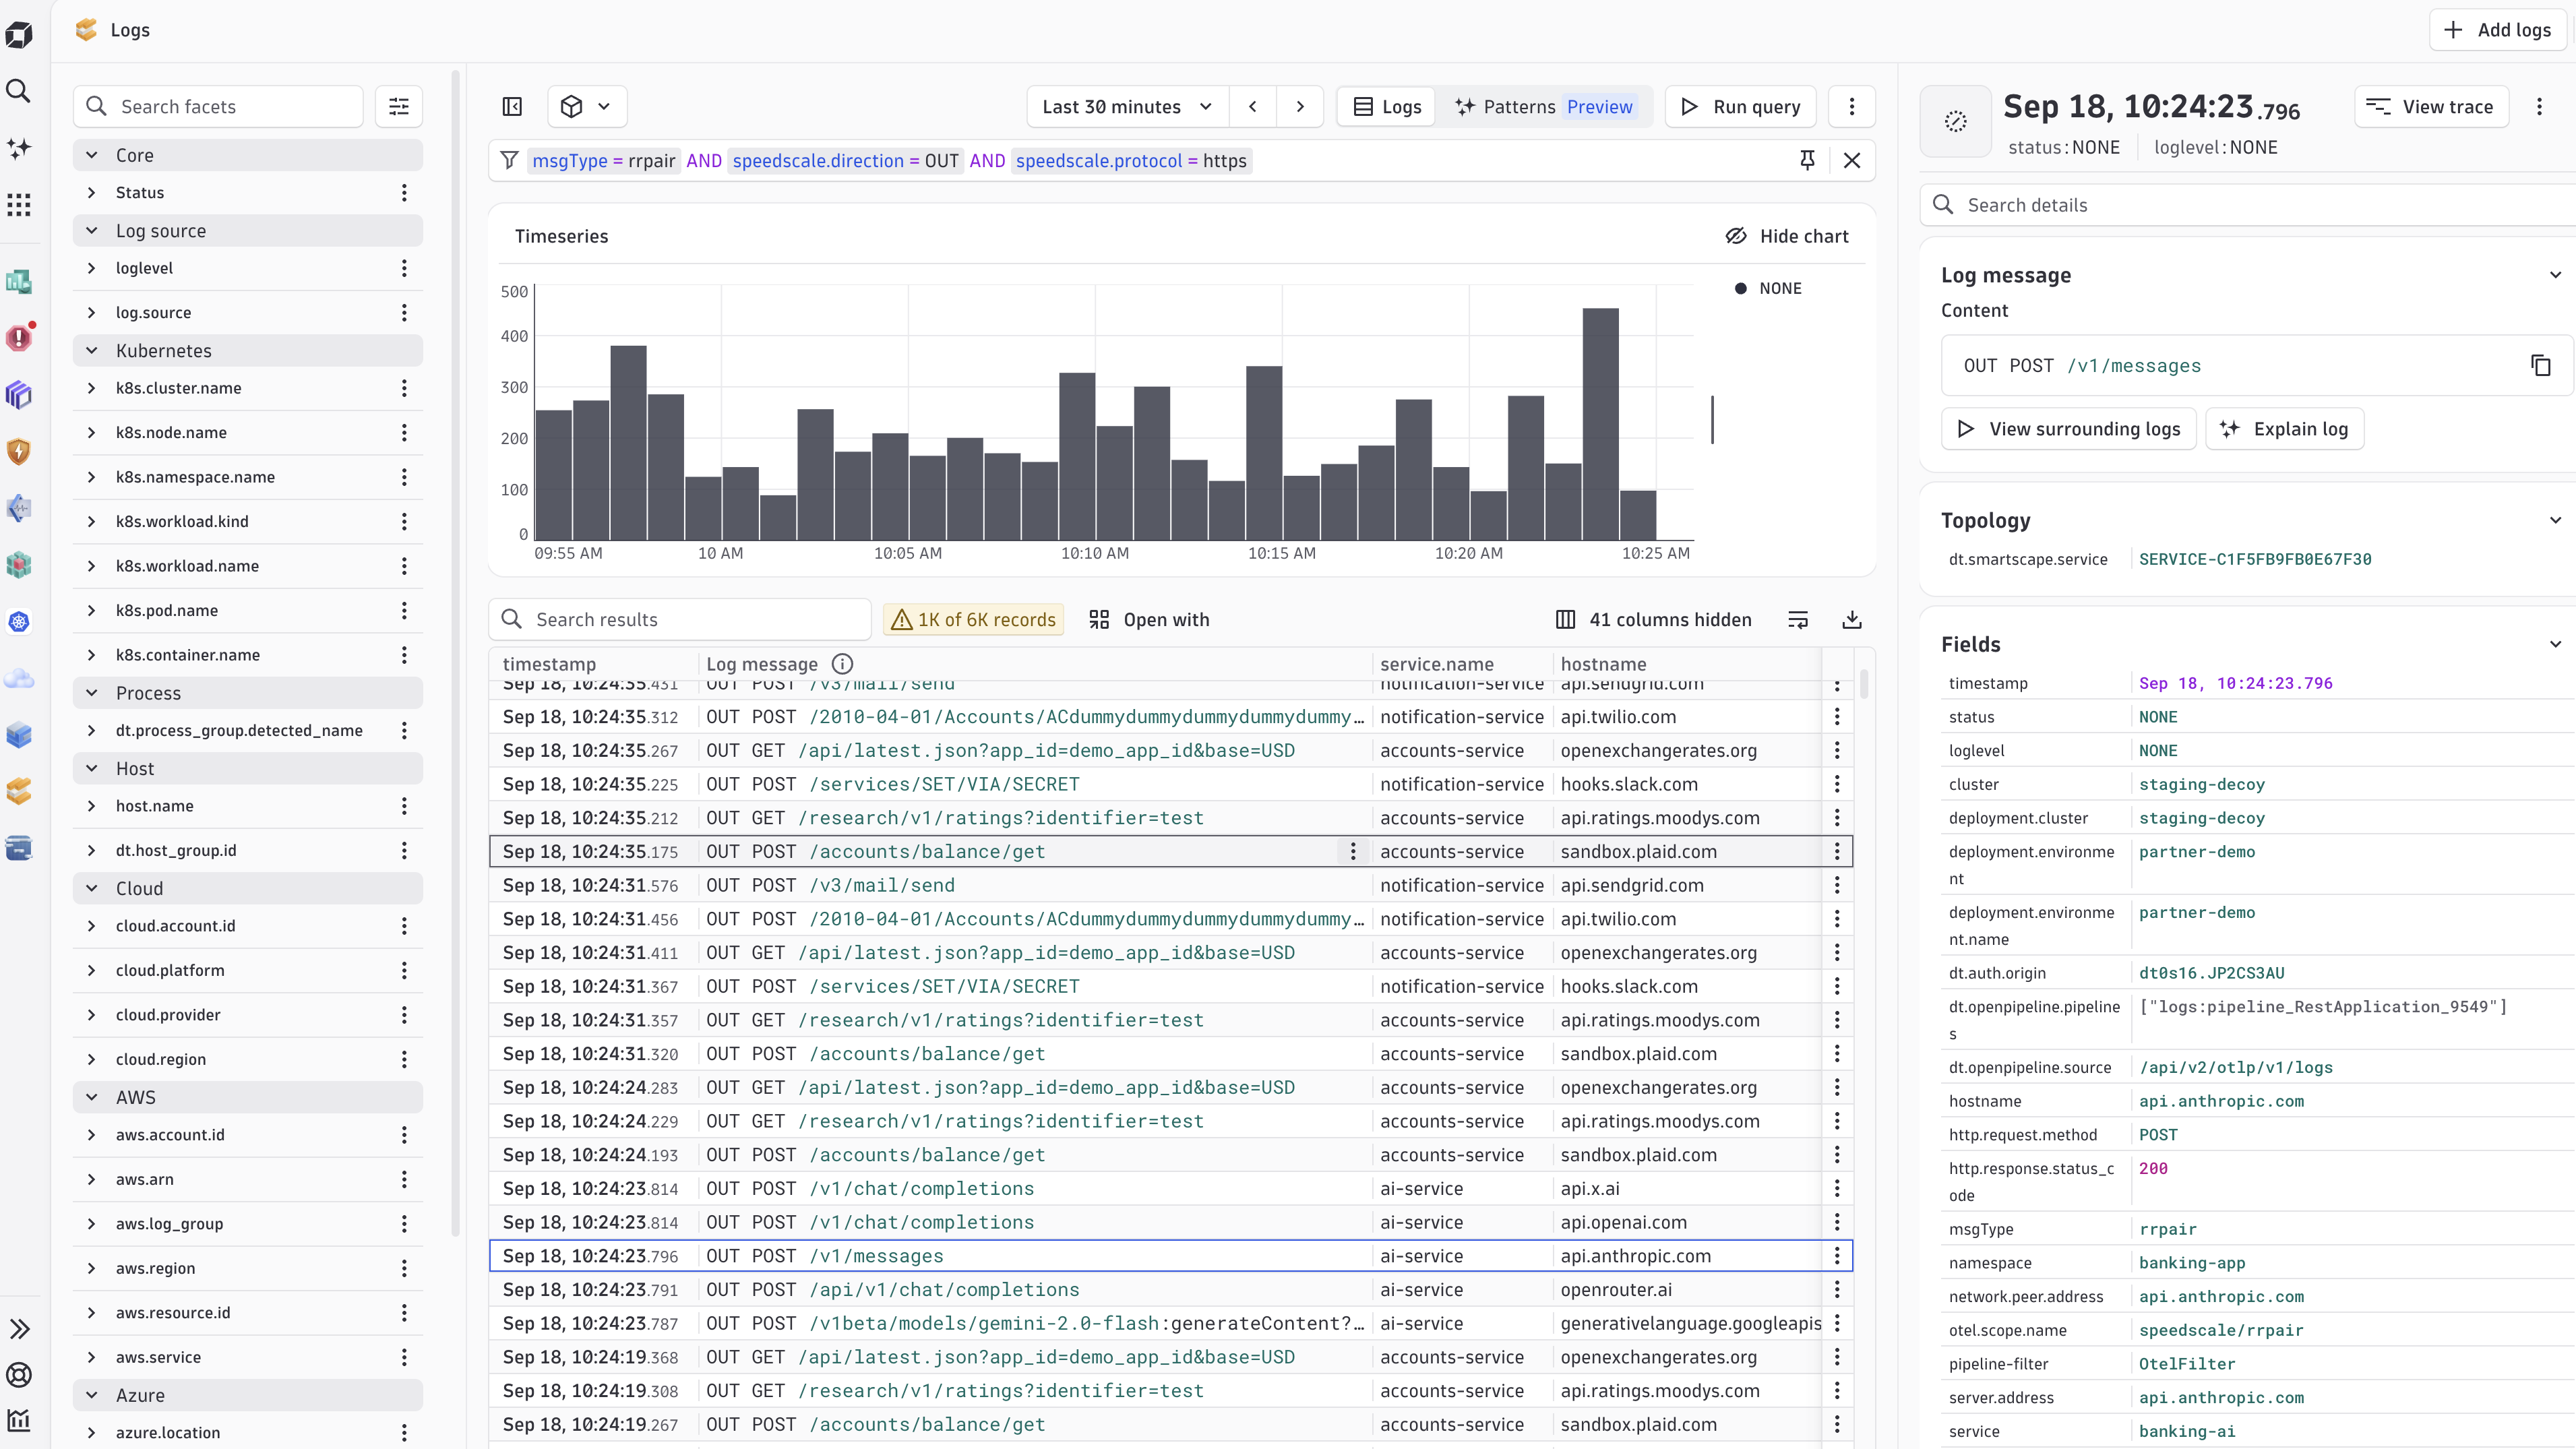
Open **Logs**, paste this expression into the **Filter field**, and select **Run query**:
```text
msgType = rrpair AND speedscale.direction = OUT
```
This is filter-field syntax, not DQL. The table only needs four columns: `timestamp`, `Log message`, `service.name`, and `hostname`. `service.name` is the source service and `hostname` is the remote destination. For example, PostgreSQL traffic can show `accounts-service` and `banking-postgres.banking-app.svc.cluster.local`.
Append `AND speedscale.protocol = https` to show only HTTPS traffic.
Open **Services** separately to confirm that application throughput, response-time, and failure charts contain current data.
Dynatrace also exposes ingest health metrics such as accepted and rejected OTLP metric data points and received spans for troubleshooting.
## Use the capture with proxymock
Dynatrace is the observability view, not the portable RRPair archive. There is no direct `proxymock import dynatrace` command. Retain the same traffic in Speedscale Cloud, Amazon S3, or Google Cloud Storage if developers need to turn a trace into local tests and mocks.
Pull a Speedscale snapshot by ID:
```bash
proxymock cloud pull snapshot '' --out ./dynatrace-capture
proxymock mock --in ./dynatrace-capture
proxymock replay --in ./dynatrace-capture \
--test-against http://localhost:8080
```
For an S3 or GCS BYOC channel, retrieve recent RRPairs by service and time range:
```bash
proxymock import s3 --bucket '' --prefix byoc/ \
--service '' --from now-1h --out ./dynatrace-capture
# Native GCS uses Google Application Default Credentials.
proxymock import gcs --bucket '' --prefix byoc/ \
--service '' --from now-1h --out ./dynatrace-capture
```
See [Use BYOC traffic with proxymock](https://docs.speedscale.com/byoc/use-traffic/) for authentication, filtering, and cluster discovery.
## Optional: exclude Speedscale pods from Dynatrace injection
Use these optional exclusions to keep application pods instrumented while preventing Dynatrace injection into Speedscale infrastructure. They are independent of the OTLP export channel configured above.
There are two places to configure:
| Scope | Configuration | Why it is needed |
| --- | --- | --- |
| Dedicated Speedscale namespace | Namespace selectors in the Dynatrace `DynaKube` resource | Excludes infrastructure running in that namespace. |
| Speedscale replay infrastructure in application namespaces | `globalAnnotations` in the Speedscale Operator chart values | Excludes pods such as generators and collectors while keeping the application under test monitored. |
Make these changes in the configuration managed by your deployment process, whether you use Helm, Argo CD, Flux, or Kubernetes manifests. Finish active replays before rolling out the changes.
### 1\. Exclude the namespace
In your existing DynaKube, add a namespace exclusion for each enabled injection feature. The example below uses `applicationMonitoring` and the default Speedscale namespace, `speedscale`:
```yaml
spec:
oneAgent:
applicationMonitoring:
namespaceSelector:
matchExpressions:
- key: kubernetes.io/metadata.name
operator: NotIn
values: ["speedscale"]
```
Merge the example into the existing resource, preserving other settings, selector labels, and match expressions. Replace `speedscale` with your dedicated Speedscale namespace. If Speedscale shares a namespace with application workloads, keep that namespace selected and use the pod annotations in step 2.
Append the same `NotIn` expression to each applicable selector:
* `spec.oneAgent.applicationMonitoring.namespaceSelector.matchExpressions`, or `spec.oneAgent.cloudNativeFullStack.namespaceSelector.matchExpressions` for cloud-native full-stack mode.
* `spec.metadataEnrichment.namespaceSelector.matchExpressions`, if enabled.
* `spec.otlpExporterConfiguration.namespaceSelector.matchExpressions`, if enabled.
Create missing selector fields as needed. Apply or sync the updated DynaKube through your usual deployment process. These selectors affect webhook injection; ActiveGate Kubernetes monitoring and OneAgent host monitoring continue.
### 2\. Exclude replay pods through Helm
Replay infrastructure also runs in application namespaces, so excluding only the Speedscale namespace does not cover it. Add this entry to the existing **Speedscale Operator chart values**, preserving any other `globalAnnotations` entries:
```yaml
globalAnnotations:
dynatrace.com/inject: "false"
```
Keep `"false"` quoted: annotation values must be strings. `globalAnnotations` is a top-level value of the `speedscale-operator` chart. The separate BYOC Dynatrace collector chart does not configure the Speedscale operator or its replay pods.
Apply the values through the workflow that owns your installation:
| Deployment workflow | Where to make the change |
| --- | --- |
| Helm | Merge the entry into the values used for your existing operator release and apply your normal upgrade process. |
| Argo CD or Flux | Update the operator chart values in your GitOps configuration, commit the change, and sync or reconcile. |
| Rendered manifests or Kustomize | Regenerate the operator manifests with these chart values, then apply them through your manifest workflow. Preserve the generated operator ConfigMap as well as the pod annotations. |
Retain your existing chart version, namespace, and other installation settings. The operator reads this configuration when creating replay infrastructure; annotating only the operator Deployment does not configure future replay pods. See [Dynatrace injection exclusions in the Helm reference](https://docs.speedscale.com/reference/helm/#dynatrace-injection-exclusions) for the configuration details.
### 3\. Restart and verify
Injection decisions apply when pods are created. Updating configuration does not remove instrumentation from existing pods.
After the DynaKube and operator configuration changes have reconciled:
1. Restart the Speedscale operator so it reads the updated configuration. Recreate existing Speedscale infrastructure pods through your normal rollout process, including nettap if enabled.
2. Wait for the replacement Speedscale pods to become Ready, then start a fresh replay.
3. Inspect the new Speedscale infrastructure and replay infrastructure pods. Confirm the replay infrastructure has `dynatrace.com/inject: "false"` under pod `metadata.annotations` and has no Dynatrace-injected init container or volume, such as `dynatrace-operator` or `oneagent-bin`.
4. Confirm application pods, including the application under test, remain instrumented and continue reporting to Dynatrace.
[Dynatrace namespace and pod exclusion reference](https://docs.dynatrace.com/docs/ingest-from/setup-on-k8s/guides/deployment-and-configuration/monitoring-and-instrumentation/annotate)
## References
* [Speedscale BYOC Dynatrace chart](https://github.com/speedscale/speedscale-byoc/tree/main/charts/dynatrace)
* [Dynatrace OTLP API endpoints](https://docs.dynatrace.com/docs/ingest-from/opentelemetry/otlp-api)
* [Configure the OpenTelemetry Collector for Dynatrace](https://docs.dynatrace.com/docs/ingest-from/opentelemetry/collector/configuration)