---
title: "Docker | Speedscale Docs"
description: "Run Speedscale components using Docker Compose to capture and replay traffic, enabling seamless API testing and integration with your applications."
canonical: "https://docs.speedscale.com/getting-started/installation/install/docker/"
---
[Documentation index](https://docs.speedscale.com/getting-started/llms.txt) | [Markdown](https://docs.speedscale.com/getting-started/installation/install/docker/index.md) | [Canonical page](https://docs.speedscale.com/getting-started/installation/install/docker/)
# Docker
Run Speedscale components via Docker Compose.
## Prerequisites
1. [Speedctl is installed](https://docs.speedscale.com/getting-started/quick-start/)
2. [Docker Desktop](https://docs.docker.com/desktop/) is installed
## Capturing Traffic
Create Docker Compose manifests by running `speedctl install`, and following the `Docker` flow that allows you to capture traffic. This will create working manifests with sane defaults. The created manifest file will be listed after the command completes.
Bring up the containers using `docker compose --file up -d` which will start the containers described in the compose file. These containers will aid in capturing traffic and sending it to the Speedscale cloud.
Now you have to configure your application to use the socks [proxy](https://docs.speedscale.com/reference/glossary/#proxy) running on `*:4140` on your server, and configure it to [trust the local certificates](https://docs.speedscale.com/getting-started/installation/sidecar/tls/#trusting-tls-certificates).
You can now run requests against your service through `localhost:4143` instead of the normal port as our [goproxy](https://docs.speedscale.com/reference/glossary/#goproxy) is acting as the entry point for the app now.
## Analyze Traffic
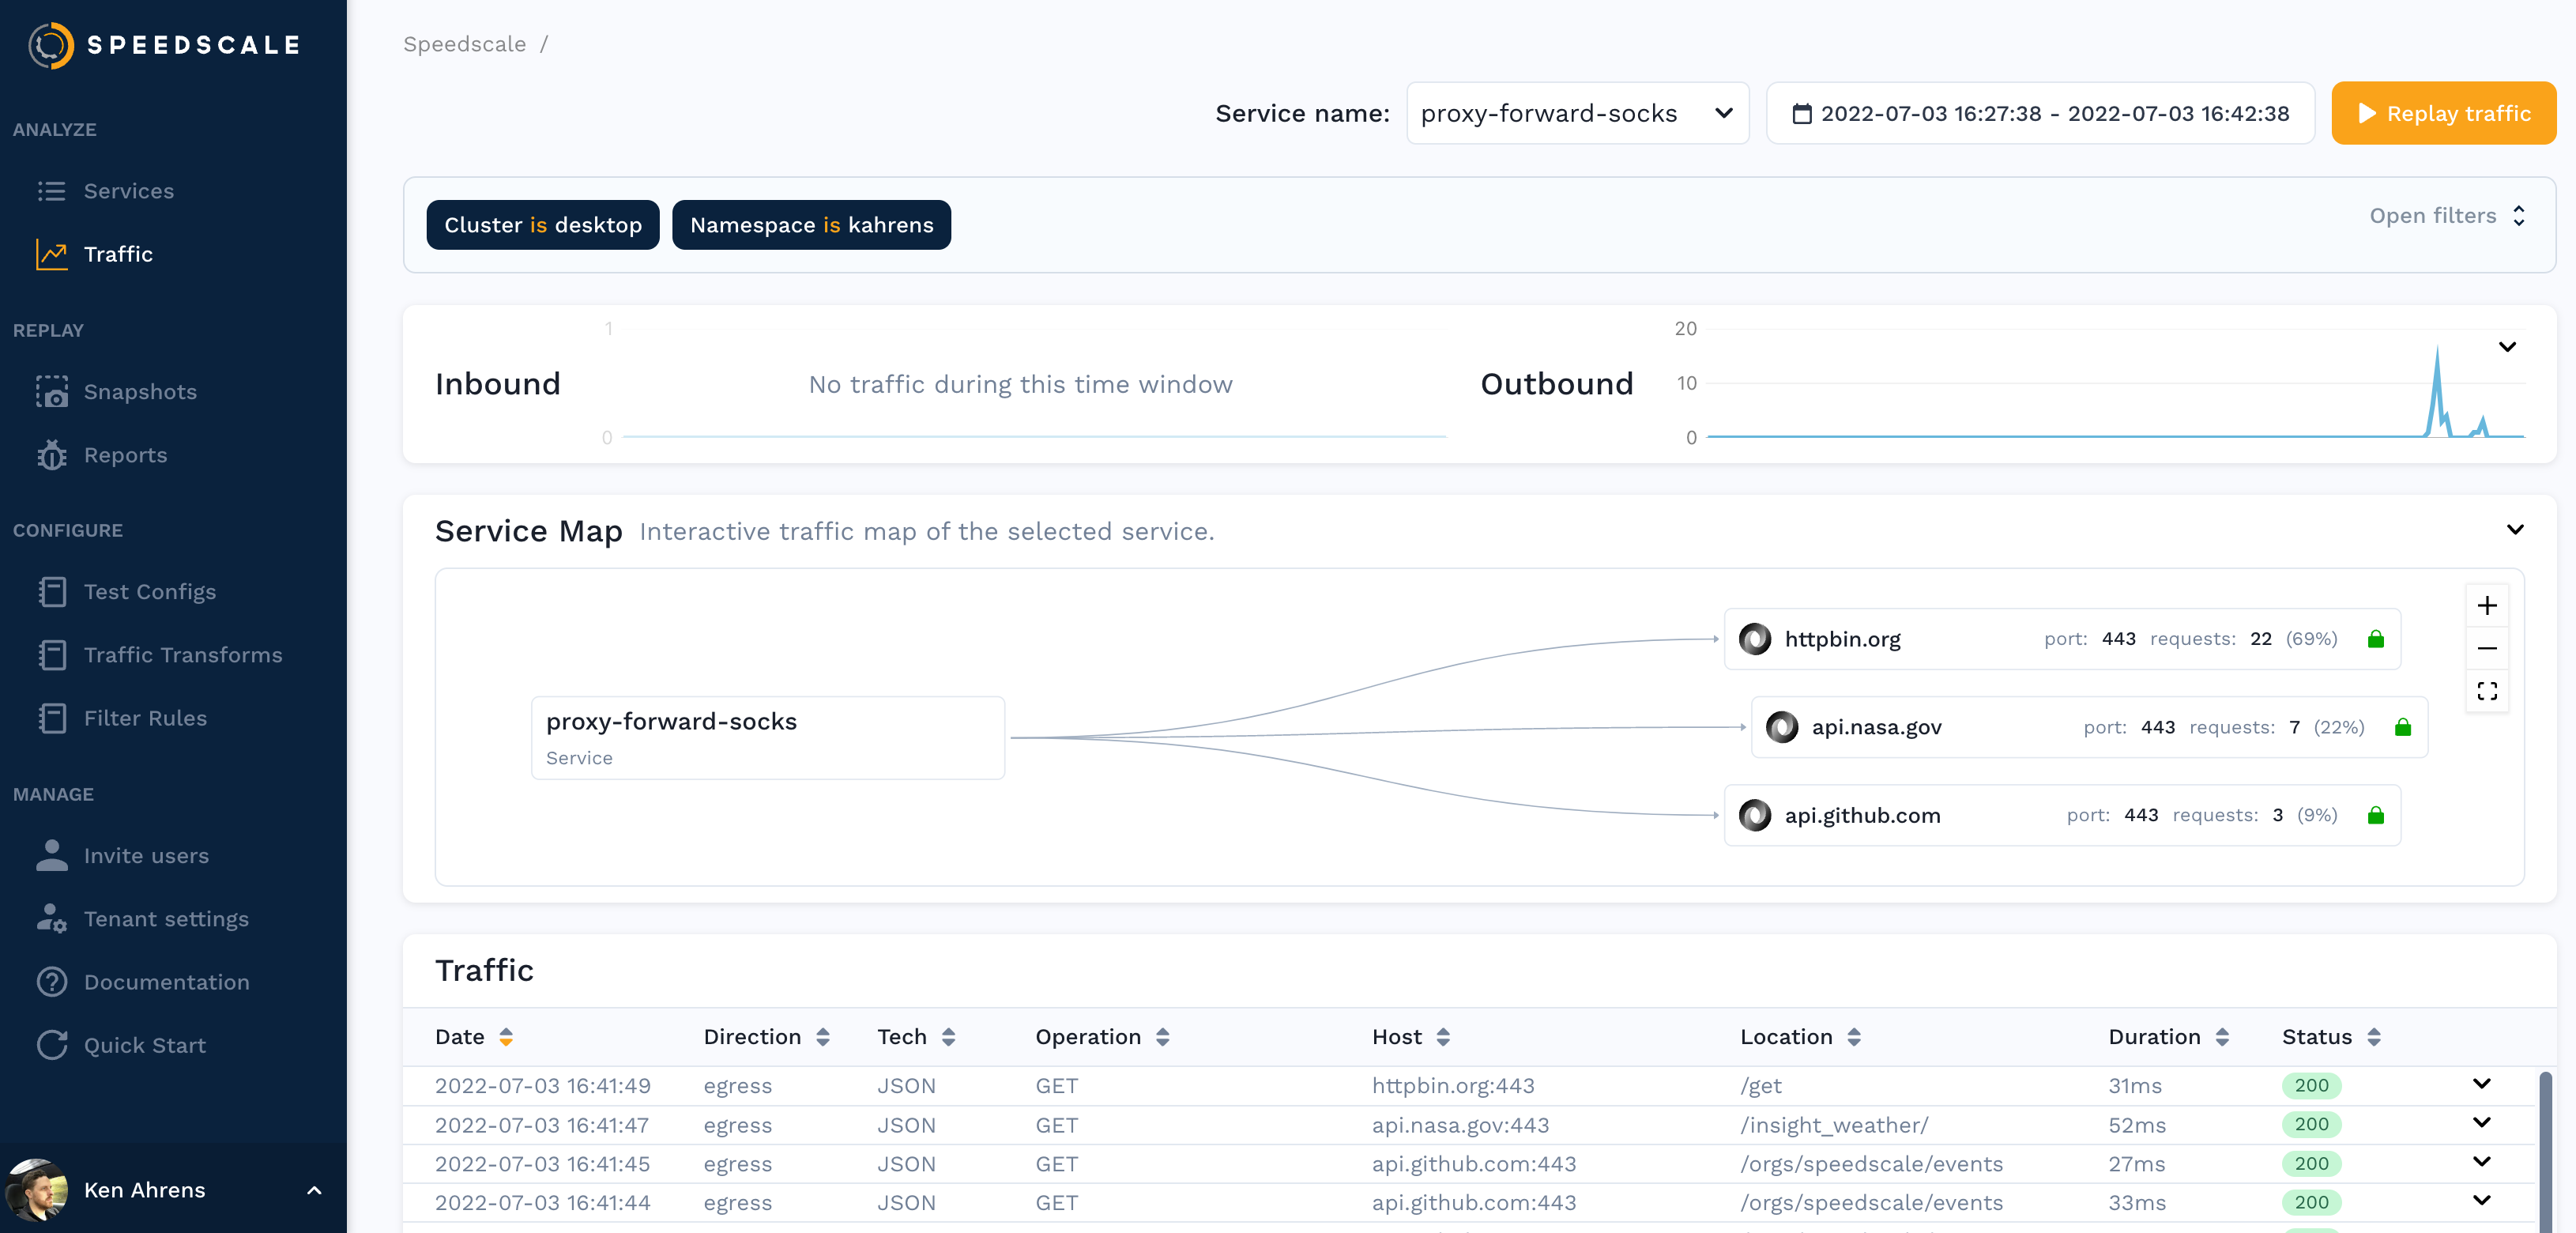
You should be able to see traffic in the Speedscale UI after a few minutes and now you can using this traffic to [create a snapshot](https://docs.speedscale.com/guides/creating-a-snapshot/).
## Replaying Traffic
Replaying traffic starts by creating manifests similar to the capture step above. Run `speedctl install` and choose the `Docker` flow that allows you to replay recorded traffic. When prompted, enter the ID of the snapshot you created.
This will generate a [report](https://docs.speedscale.com/reference/glossary/#report) which you can find on the [reports page](https://docs.speedscale.com/guides/reports/).
note
The `speedctl install` command is just a helper and environment variables like `SNAPSHOT_ID` and `TEST_CONFIG_ID` can be modified in the manifest file without regenerating it every time.